TL;DR:
- Focusing on a bottom-up SAM helps founders plan realistic territories and sales efforts effectively.
- SAM guides early go-to-market decisions, while SOM translates sales capacity into achievable revenue targets.
TAM, SAM, and SOM are concentric market-size metrics, but only one of them should drive your first-year decisions: SAM. Your Total Addressable Market shows investors the ceiling; your Serviceable Addressable Market tells your sales team who to call; your Serviceable Obtainable Market is the number you're actually accountable for in the next 12–24 months. Founders who lead with a bottom-up SAM and a capacity-grounded SOM close investor conversations faster and build more credible territory plans than those who wave at a giant TAM and claim 1% of it.
Quick actions before you read further:
- Build your SAM bottom-up: count companies that match your ICP, multiply by ACV, and filter by geography and channel.
- Calculate SOM from your sales capacity and CAC, not from a percentage of TAM.
- Export your SAM account list to your CRM and use it as your territory plan.
For U.S. data, lean on the U.S. Census Bureau, Bureau of Labor Statistics, and Statista for top-down sanity checks. For a living TAM/SAM/SOM model that connects those numbers to your ICP and pitch, Klaritea automates the structure from a single-line idea.
Table of Contents
- What do TAM, SAM, and SOM actually mean?
- Why these numbers matter to founders and investors
- How do you calculate TAM, SAM, and SOM step by step?
- How do you estimate SOM from SAM in practice?
- What mistakes do founders make with TAM, SAM, and SOM?
- Where do you find trustworthy U.S. data for your model?
- How do you build a working TAM/SAM/SOM template in 15 minutes?
- Why SAM should drive your early GTM decisions
- Key Takeaways
- The number that actually matters in year one
- Klaritea turns your market sizing into a plan you can ship
- Useful U.S.-focused sources and further reading
- FAQ
What do TAM, SAM, and SOM actually mean?
These three metrics form a funnel, each one a tighter slice of the one above it. Getting the definitions precise matters because investors will probe the boundaries, and a fuzzy answer signals that you haven't done the work.
TAM — Total Addressable Market is the theoretical revenue ceiling if you sold to every possible customer in your category with no competitive, geographic, or channel constraints. It's a signal for scale, not a plan. One-line example: If every U.S. company with 50–500 employees spent $12,000 per year on HR software, and there are 200,000 such companies, TAM = $2.4 billion.

SAM — Serviceable Addressable Market is the portion of TAM you can actually reach given your product's current capabilities, your distribution model, and your target geography. This is the number your sales team works from. One-line example: Filter that 200,000 to the 40,000 U.S. companies in professional services that use cloud-based HR tools and have a dedicated HR manager. At $12,000 ACV, SAM = $480 million.
SOM — Serviceable Obtainable Market is the revenue you can realistically capture from SAM in the next 12–24 months, constrained by your headcount, CAC, and conversion rates. One-line example: With two sales reps each closing 30 accounts per year at $12,000 ACV, SOM = $720,000 in year one.
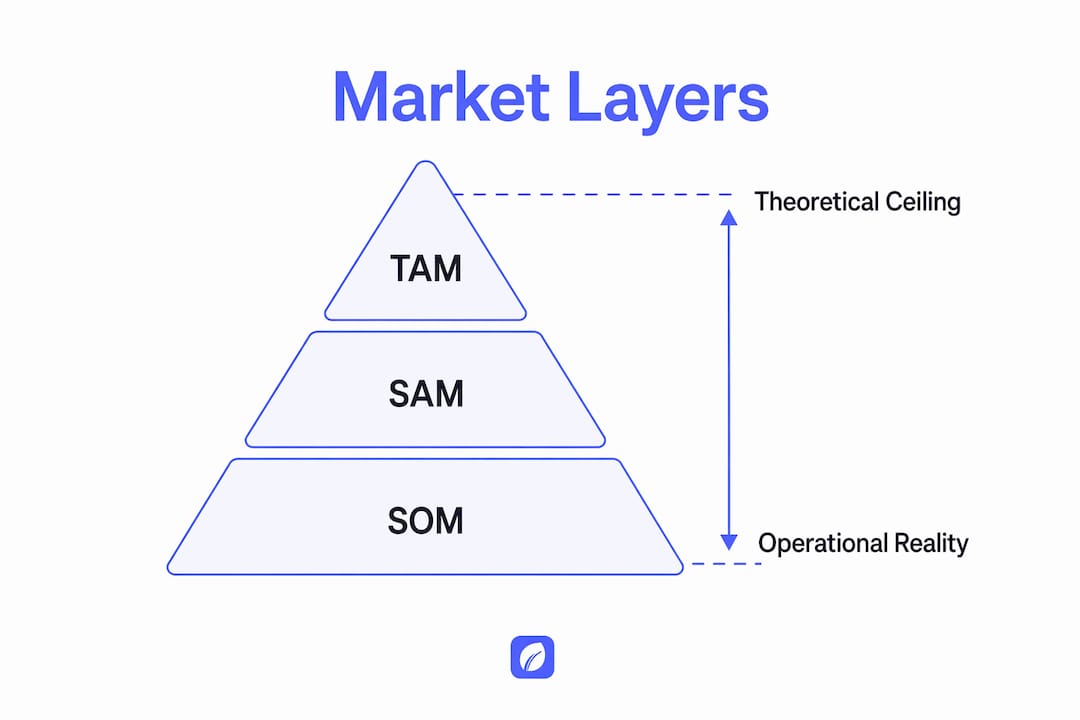
As HG Insights explains, TAM is the theoretical ceiling, SAM is the reachable target, and SOM is operational reality. Keep that hierarchy in mind every time you build a slide.
Three calculation methods and when to use each
TechTarget notes four common approaches: third-party research reference, top-down, bottom-up, and value theory. In practice, most founders need two of them.
- Top-down: Start with an analyst report (Gartner, IBISWorld, Statista) and apply percentage filters to narrow to your segment. Fast, but prone to overcounting.
- Bottom-up: Count actual companies or customers that fit your ICP, multiply by ACV or average spend. Slower, but far more defensible.
- Value theory: Price based on the value you create, then estimate adoption. Useful for category-creating products with no existing market data.
Use top-down for investor context. Use bottom-up for planning.
Why these numbers matter to founders and investors
The three metrics do different jobs, and conflating them is one of the fastest ways to lose credibility in a pitch room.
From a founder's perspective, SAM is the operational number. It maps directly to an in-scope account list that sales can work against, which means it drives territory design, quota setting, and hiring decisions. SOM sets your 12–24 month revenue target and should match your capacity model. If your SOM implies closing 400 accounts but you have one sales rep, the math breaks immediately.

From an investor's perspective, TAM shows that the opportunity is worth pursuing. A TAM under $500 million makes most venture investors hesitant because the return math rarely works at that scale. But TAM alone doesn't close rounds. As HubSpot's market sizing guide puts it, top-down numbers show scale while bottom-up numbers demonstrate operational understanding. Investors want both, and they'll trust the bottom-up more.
Where founders misuse these metrics:
- Citing a $50 billion TAM and claiming 1% without any bottom-up proof.
- Using SAM and TAM interchangeably in the same deck.
- Presenting a SOM that's a round percentage of TAM with no capacity math behind it.
- Ignoring churn when projecting SOM over multiple years.
A few practical use cases where getting this right pays off directly: when you're deciding which customer segment to prioritize first, your SAM filters tell you where the density is. When you're setting a fundraising ask, your SOM tells you how much runway you need to hit the revenue milestone that justifies the next round. When you're hiring your first sales rep, your bottom-up SAM tells you whether the territory can support quota.
How do you calculate TAM, SAM, and SOM step by step?
The core formulas
- TAM = Total potential customers × ARPU (annual revenue per user)
- SAM = Filtered customer count (by ICP, geography, channel) × ARPU
- SOM = Portion of SAM reachable given sales capacity, CAC, and conversion rate
Top-down method: worked example
Start with a Statista or Gartner figure for your category. Say the U.S. project management software market is $6 billion annually. You serve only construction companies with 10–200 employees, which represent roughly 8% of the software buyer universe in that category. Top-down SAM = $6B × 8% = $480 million. That's your investor context number. It's fast, but as Landbase's B2B analysis points out, top-down TAMs can overstate opportunity by 3–10x versus bottom-up counts, so never stop there.
Bottom-up method: B2B SaaS worked example
This is the method that actually drives decisions.
- Pull U.S. company counts from the Census Bureau's County Business Patterns or a firmographic data provider, filtered by NAICS code (e.g., 236 for construction), employee range (10–200), and state.
- Apply ICP filters: companies that use cloud-based tools (tech stack signal), have a project manager on staff (job posting signal), and are in your target states. Say you get 22,000 companies.
- Multiply by ACV: 22,000 × $8,400 = SAM of $184.8 million.
- Apply a realistic conversion rate for your stage. At seed, 0.5–1% of SAM accounts in year one is defensible. At 0.75%: 22,000 × 0.0075 = 165 accounts × $8,400 = SOM of $1.39 million.
That number is something you can defend line by line.
B2C worked example
For a direct-to-consumer subscription, the math is simpler but the data sources differ. Say you're launching a meal-kit service targeting U.S. households earning $75,000+ with two or more people. The Census Bureau's American Community Survey puts that universe at roughly 35 million households. Filter to households in metro areas with same-day delivery infrastructure: 12 million. At $180 annual subscription value, SAM = $2.16 billion. SOM in year one, targeting two metro markets with a $40 CAC and $50,000 marketing budget: 1,250 customers × $180 = $225,000.
Calculation method comparison
| Method | Pros | Cons | Best for |
|---|---|---|---|
| Top-down | Fast; uses published data; good for investor slides | Overstates opportunity; hard to operationalize | TAM framing, investor context |
| Bottom-up | Defensible; maps to real accounts; drives sales planning | Time-intensive; requires ICP clarity | SAM and SOM; operational planning |
| Value theory | Useful for new categories | Highly speculative; hard to validate | Category-creating products only |
Assumptions to document
Every number in your model should have a documented assumption. At minimum, capture these:
| Assumption | Example value | Source |
|---|---|---|
| Target geography | 50 U.S. states or specific MSAs | Census Bureau |
| ICP filters | NAICS code, employee range, tech stack | Firmographic provider |
| ACV / ARPU | $8,400 | Internal pricing |
| Conversion rate | 0.75% of SAM per year | Comparable benchmarks |
| CAC | — | Pilot campaign data |
| Churn rate | 12% annually | SaaS industry benchmarks |
| Timeframe | 12 months | Board-approved plan |
Pro Tip: Build your assumptions on a separate tab in your spreadsheet and wire every formula to it. When an investor challenges a number, you change one cell and the whole model updates.
How do you estimate SOM from SAM in practice?
SOM is where most founders either get too optimistic or give up and write "1% of SAM." Neither works. The right approach is to build SOM from your actual capacity and then cross-check it against stage-appropriate benchmarks.
Capacity-to-revenue conversion
Start with your sales headcount. Each full-cycle sales rep at an early-stage B2B SaaS company can typically manage 15–40 new accounts per year depending on deal complexity and ACV. Multiply by your ACV and you have a capacity-constrained SOM ceiling. Then apply your expected conversion rate from outreach to close to get a realistic number.
Example: Two reps × 25 closes per year × $8,400 ACV = $420,000 SOM ceiling. Apply a 70% attainment assumption (common for early-stage teams still refining their pitch): $294,000 realistic SOM.
Stage-appropriate SOM ranges
These are practical reference ranges, not guarantees. Your actual number depends on channel, deal complexity, and how well your ICP is defined.
| Stage | Typical SOM as % of SAM | Channel assumption |
|---|---|---|
| Pre-seed | 0.5–1% | Founder-led sales, warm network |
| Seed | 0.5–1% | Founder-led + first sales hire |
| Series A | 0.4–1.2% | Dedicated sales team, some inbound |
| Growth | 1–5%+ | Multi-channel, partnerships |
As TryBuildCo's worked examples show, grounding SOM in CAC, sales capacity, and conversion rates is the approach investors prefer for projections.
Testing SOM assumptions before you commit
Don't wait for a full launch to validate your SOM. Run small experiments:
- Sign up 10 pilot accounts and measure actual conversion rate from first contact to close.
- Track CAC on a paid pilot campaign in one metro market before projecting nationally.
- Use a 30-day paid trial to measure activation and churn before modeling annual retention.
Each data point tightens your assumptions and makes the SOM number harder to challenge.
What mistakes do founders make with TAM, SAM, and SOM?
The most damaging errors aren't math errors. They're structural ones that signal to investors that the founder doesn't understand their market.
Common mistakes:
- Using a top-down analyst TAM as your only number and presenting it as achievable revenue.
- Stacking unvalidated percentages: "The market is $10B, we'll capture 10% of 10% of 10%." Each filter needs a source.
- Ignoring channel constraints. If you sell only through direct outbound, your SAM excludes companies that only buy through resellers.
- Ignoring churn. A SOM projection that doesn't account for annual churn overstates cumulative revenue by year three.
- Using data that's more than two years old. Market structures shift, especially in software categories.
Business Model Hacking's analysis recommends updating SAM at minimum quarterly, which is the right cadence for early-stage companies still refining their ICP.
How to document assumptions so they're verifiable:
For each assumption, record the source name, URL, date accessed, the specific filter or figure you used, and a sensitivity range (low/base/high). If your conversion rate assumption is 0.75%, document what happens to SOM at 0.4% and at 1.2%. That sensitivity range shows investors you've stress-tested the model.
Red flags that make investors distrust your numbers:
- No source cited for any filter or percentage.
- SOM that's a suspiciously round number (exactly 1% of TAM).
- TAM that's larger than the entire industry's reported revenue.
- No mention of CAC, churn, or sales capacity anywhere in the model.
Pro Tip: Build a live account-level TAM database by pulling 200–300 companies from your ICP filters and manually reviewing 10 of them. Check whether they actually fit your product, what they currently spend, and whether they'd be reachable through your channel. That 10-account sample will tell you more about your real SAM than any analyst report.
Where do you find trustworthy U.S. data for your model?
Using credible sources isn't just about accuracy. It's about being able to answer "where did that number come from?" in a pitch meeting without hesitating.
| Source | What it provides | Best used for |
|---|---|---|
| U.S. Census Bureau (County Business Patterns, ACS) | Company counts by NAICS, employee range, geography; household demographics | Bottom-up TAM and SAM company counts; B2C demographic filters |
| Bureau of Labor Statistics (BLS) | Employment by industry, occupation counts, wage data | Sizing labor-related markets; validating industry scale |
| Statista | Category spend estimates, consumer survey data, market size by vertical | Top-down TAM framing; investor slide context |
| Gartner / IBISWorld / Forrester | Analyst market size reports by technology or industry category | Top-down sanity checks; quoting in pitch decks |
| Firmographic data providers (by NAICS/SIC, employee range, tech stack) | Company-level counts with filters for ICP matching | Bottom-up SAM account lists; CRM import |
For each data point in your model, capture: source name, URL, date accessed, and the specific filter or table you used. A spreadsheet with a "Sources" tab that lists this metadata takes 20 minutes to build and saves hours of back-and-forth with investors.
For founders sizing SAM in regulated verticals, the filtering logic gets more complex. A healthcare SaaS go-to-market strategy requires layering in licensing, payer mix, and EMR adoption data on top of standard firmographic filters, which is a good illustration of how vertical-specific your ICP filters need to be.
How do you build a working TAM/SAM/SOM template in 15 minutes?
You don't need a sophisticated model to start. A five-tab spreadsheet covers everything a seed-stage founder needs.
Template structure:
- Tab 1 — Assumptions: Every variable (ACV, conversion rate, CAC, churn, geography, timeframe) with source and sensitivity range.
- Tab 2 — Company List / TAM: Raw company count from Census or firmographic provider, filtered by NAICS and employee range. Formula:
=COUNTA(company_list) * ACV_assumption. - Tab 3 — SAM Filters: Apply ICP filters (tech stack, job titles, geography) to reduce TAM count. Formula:
=TAM_count * ICP_filter_rate * ACV_assumption. - Tab 4 — SOM Capacity Model: Sales rep count × annual closes per rep × ACV × attainment rate. Cross-check against SAM percentage.
- Tab 5 — Outputs: Summary table showing TAM, SAM, SOM with top-down and bottom-up versions side by side.
Populating it in 15 minutes:
- Go to the Census Bureau's County Business Patterns and pull company counts for your NAICS code and employee range. Paste into Tab 2.
- Enter your ACV from your pricing page or pilot data into Tab 1.
- Estimate your ICP filter rate (what percentage of those companies actually fit your product). Start at 20–30% and adjust after your 10-account sample.
- Enter your sales headcount and expected annual closes per rep into Tab 4.
- Tab 5 calculates automatically.
Once your SAM account list is built, export it as a CSV and import it into your CRM as a target account list. Tag each account with the ICP tier (Tier 1, Tier 2, Tier 3) based on fit score, and assign territories by rep. That's your startup management workflow moving from market sizing to pipeline in one step.
For strategic planning tools that can automate assumption checks and scenario analysis, AI-assisted platforms are increasingly useful for keeping this model current as your ICP evolves.
Why SAM should drive your early GTM decisions
The case for leading with a bottom-up SAM isn't theoretical. It's operational. When you know exactly which 22,000 companies fit your ICP, you can assign territories, set quota, and prioritize outreach by fit score. When you know your SOM is $1.39 million based on two reps closing 165 accounts at $8,400 ACV, you can build a hiring plan that supports it. TAM tells you the game is worth playing. SAM tells you how to play it.
Antler's investor guidance is direct on this: investors expect a defensible SOM with clear assumptions and sensitivity ranges, not optimistic fixed percentages. The founders who walk in with a bottom-up account list and a capacity model close faster than those who lead with a $10 billion TAM and a 1% claim.
How a founder converts SAM into execution:
Say you've built a bottom-up SAM of 22,000 construction companies. You tier them: 2,000 Tier 1 accounts (best fit, highest ACV potential), 8,000 Tier 2, and 12,000 Tier 3. Your first sales rep focuses exclusively on Tier 1. You set quota at 25 new accounts in year one, which at $8,400 ACV = $210,000 ARR. That's a territory plan, a quota, and a hiring trigger (hire rep two when rep one hits 80% of quota) all derived from one bottom-up SAM exercise.
Klaritea is built for exactly this phase. As an AI-powered phase 0 planning tool, it structures and connects your ICP, TAM/SAM/SOM, competitor analysis, features, requirements, build spec, and pitch into a single connected model. Its AI advisory board, with Maya (marketing), Devon (business), and Priya (ops & QA), researches, challenges, and fact-checks your assumptions before you commit budget. Outputs include detailed build specifications, clarity scorecards, and printable reports, with sync to GitHub, Notion, and Confluence for teams that need to move from plan to execution.
Key Takeaways
A defensible TAM/SAM/SOM model is built bottom-up from real ICP account counts, documented assumptions, and capacity-constrained SOM math, not from analyst percentages applied to a giant market figure.
| Point | Details |
|---|---|
| SAM drives GTM decisions | Build SAM bottom-up from ICP-filtered company counts and ACV, then export to CRM as your territory plan. |
| SOM requires capacity math | Calculate SOM from sales rep count, annual closes, and ACV, not as a percentage of TAM. |
| Document every assumption | Record source, URL, date, filter criteria, and a low/base/high sensitivity range for each input. |
| Use U.S. primary sources | Census Bureau, BLS, and Statista give you the firmographic and spend data to build and sanity-check your model. |
| Klaritea structures the model | Klaritea's AI-powered phase 0 workspace connects ICP, TAM/SAM/SOM, and pitch into one living plan from a single-line idea. |
The number that actually matters in year one
Most early-stage founders spend too long on TAM and not enough time on the 200-account list that should be sitting in their CRM by week two. TAM is a story you tell investors. SAM is the work you do before you hire your first rep. SOM is the commitment you make to your board. The founders who get this right don't have better data than everyone else. They just ask a more specific question: not "how big is the market?" but "how many companies can we actually reach this year, and what does closing 1% of them look like?" That question, answered with a bottom-up model and a documented assumptions tab, is worth more than any analyst report. Revisit your SAM every quarter as your ICP sharpens, and revisit SOM assumptions monthly during early scale when conversion rates are still moving.
Klaritea turns your market sizing into a plan you can ship
Most founders run their TAM/SAM/SOM analysis once, drop it in a pitch deck, and never look at it again. That's the problem Klaritea solves. You describe your idea in a single line, and Klaritea builds a structured, connected model covering your ICP, TAM/SAM/SOM, competitor analysis, features, requirements, and pitch, all in one place. The three AI advisors, Maya, Devon, and Priya, actively challenge your assumptions and flag gaps before you spend a dollar on development or outreach.

For first-time founders, that means you can build a bottom-up SAM in one session, generate an investor-ready SOM with documented assumptions, and sync your target account list directly to your execution workflow. No more static spreadsheets that go stale after the first board meeting. Start with Klaritea and turn your market sizing into a living plan that moves with your business.
Useful U.S.-focused sources and further reading
These are the primary sources worth bookmarking for your model. For each one, record the date you accessed it and the specific table or filter you used.
- U.S. Census Bureau — County Business Patterns: Company counts by NAICS code, employee range, and geography. Refresh annually; use for bottom-up TAM and SAM company counts. census.gov
- Bureau of Labor Statistics (BLS): Employment by industry, occupation counts, wage data. Useful for sizing labor-related markets and validating industry scale. bls.gov
- Statista: Category spend estimates and consumer survey data. Use for top-down TAM framing on investor slides; note the publication date of each report.
- Gartner / IBISWorld / Forrester: Analyst market size reports by technology or industry vertical. Use for top-down sanity checks; always cite the report name, year, and page number.
- Firmographic data providers (by NAICS/SIC, employee range, tech stack): Company-level counts for ICP matching. Use for bottom-up SAM account lists and CRM import. Refresh quarterly as companies enter and exit your ICP filters.
For your spreadsheet, add a "Sources" tab with columns for: source name, URL, date accessed, specific filter or table used, and the figure you pulled. Refresh Census and BLS data annually, Statista figures when a new report publishes, and your firmographic account list every quarter.
FAQ
What is the difference between TAM, SAM, and SOM?
TAM is the total theoretical revenue if you captured every possible customer in your category; SAM is the portion reachable given your product, geography, and channel; SOM is the revenue you can realistically capture in the next 12–24 months given your sales capacity and CAC.
How do you calculate SOM from TAM and SAM?
Don't calculate SOM as a percentage of TAM. Instead, multiply your sales rep count by annual closes per rep, then multiply by ACV, and cross-check that result against a realistic percentage of your bottom-up SAM (typically 0.05–1% depending on stage).
What does SAM mean in the context of TAM?
SAM (Serviceable Addressable Market) is the filtered subset of TAM that your product can actually serve given current capabilities, distribution, and geography. As HG Insights explains, it's the reachable target, not the theoretical ceiling.
How do you represent TAM, SAM, and SOM in a pitch deck?
Show both a top-down TAM (from an analyst report) for investor context and a bottom-up SAM with your ICP filters documented. Present SOM with explicit capacity math: rep count, annual closes, and ACV. Antler's guidance recommends including sensitivity ranges rather than a single fixed number.
Can Klaritea help me build a TAM/SAM/SOM model?
Yes. Klaritea's AI-powered phase 0 workspace structures your ICP, TAM/SAM/SOM, competitor analysis, and pitch into a connected model from a single-line idea, with AI advisors that challenge your assumptions before you invest in building.