An opportunity solution tree is a living discovery map that connects a single measurable outcome to the customer needs that could move it, the competing solutions your team might build, and the smallest experiments that test whether those solutions actually work. It was developed by Teresa Torres and documented in her book Continuous Discovery Habits and on ProductTalk. The OST is not a roadmap. It does not commit you to shipping anything; it commits you to learning.
Before you read another word, here are three things your product trio can do in the next 48 hours:
- Write one measurable outcome in the form of a behavior metric your team controls (for example, "increase week-2 retention from 34% to 45%").
- Schedule three story-based customer interviews for this week, one per day if possible.
- Pick one customer need from your last round of interviews and make it the first opportunity branch on a blank canvas.
That is the entire practice in miniature. Everything below shows you how to do it well.
Key Takeaways
The opportunity solution tree works because it forces a specific sequence: outcome first, then customer-evidenced opportunities, then competing solutions, then the smallest experiments that test riskiest assumptions, updated weekly.
| Point | Details |
|---|---|
| Sequence is non-negotiable | Always move from outcome to opportunities to solutions to experiments; reversing any step corrupts the tree. |
| Interviews before branches | Run at least three story-based interviews and cite each one before adding any opportunity to the tree. |
| Weekly cadence or it stales | A tree untouched for more than two weeks stops functioning as a discovery tool and becomes a status artifact. |
| Multiple solutions per opportunity | A single solution per opportunity is a red flag; aim for at least three candidates before evaluating any. |
| Klaritea for early-stage clarity | Klaritea applies OST-style thinking early, helping founders map opportunities and validate assumptions before writing a line of code. |
Table of Contents
- What an opportunity solution tree actually looks like
- Who should own an OST and what you need before you start
- How to build an OST from scratch
- How to prioritize opportunities and pick the right experiments
- How to keep an OST alive week to week
- Common OST mistakes and how to fix them fast
- OST versus impact mapping, problem trees, and story maps
- Templates, tools, and a worked example you can copy today
- What the research says about OST best practices
- When OST insights tell you to scale or pivot
- Real-world OST impact: what teams actually report
- How to read experiment data and update your OST
- The OST in practice: a perspective worth considering
- Klaritea helps you structure your ideas before you build
- Sources
- FAQ
What an opportunity solution tree actually looks like
The OST has four layers, each with a distinct job. Understanding the difference between them is what separates teams that use the tree as a thinking tool from teams that use it as a fancy sticky-note board.
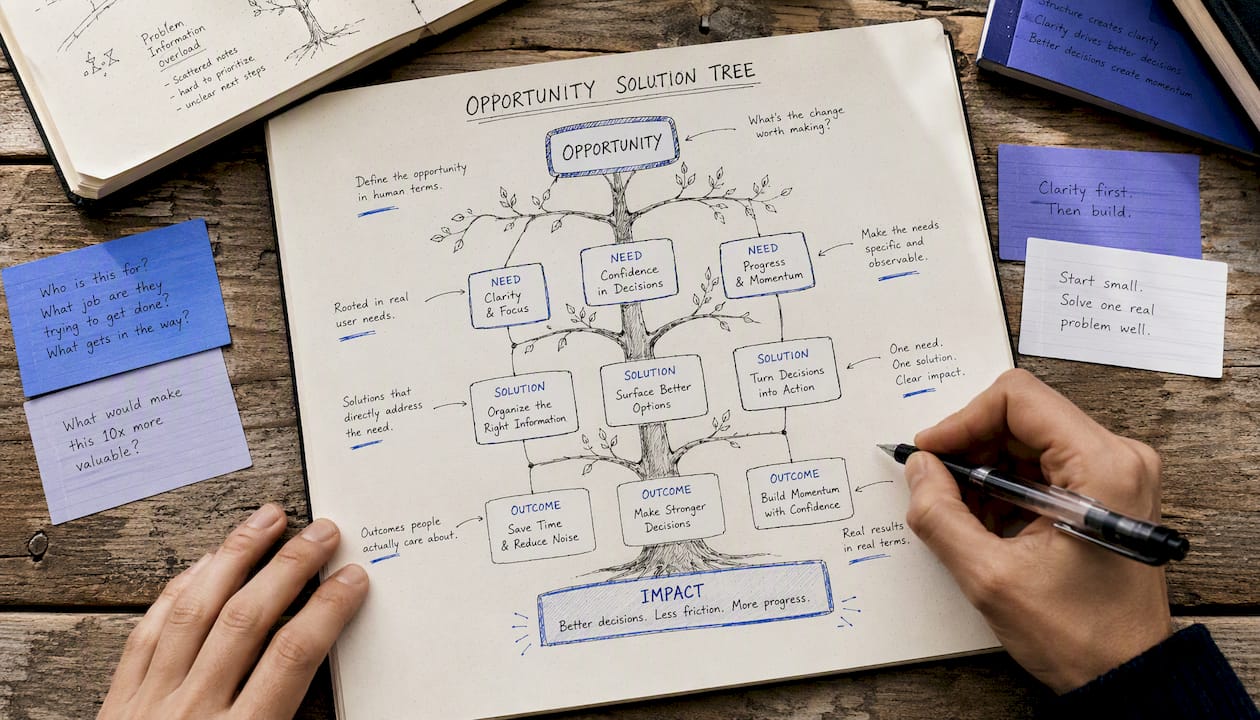
| Layer | Purpose | How to phrase it | Example artifact |
|---|---|---|---|
| Outcome | The measurable behavior the business cares about | "Increase [metric] from X to Y by [date]" | "Grow 30-day activation from 41% to 55% by Q3" |
| Opportunities | Customer needs, pain points, or desires surfaced in interviews | Phrased in the customer's own voice | "I never know if I set the thing up correctly" |
| Solutions | Candidate product responses to a specific opportunity | Concrete but not yet committed | Setup progress indicator, inline checklist, guided tour |
| Experiments | The smallest test of the riskiest assumption in a solution | Hypothesis + metric + pass/fail rule | Fake-door click test; target: 15% click-through in 5 days |
Teresa Torres describes the OST as a visual thinking tool whose primary function is to make implicit assumptions visible. Every branch you draw is a bet. The tree shows you which bets you are making and which ones you have not tested yet.
A few rules of thumb worth internalizing now:
- Outcomes are metrics, not features. "Launch onboarding v2" is a solution, not an outcome.
- Opportunities come from interviews, not from brainstorming sessions. If you cannot point to a specific customer who said it, it does not belong on the tree yet.
- Solutions should always be plural. A single solution per opportunity is a red flag that the team has already decided and is using the tree to justify the decision.
- Experiments are not sprints. They are the smallest possible test of the riskiest assumption, designed to be invalidated quickly.
Who should own an OST and what you need before you start
The OST belongs to the product trio: product manager, designer, and engineer. That is not a suggestion. The whole point of the structure is that all three roles contribute evidence and challenge each other's assumptions in real time. Handing it to the PM alone turns it into a prioritization list. Handing it to the designer alone turns it into a journey map.
Stakeholder boundaries matter. Share the outcome with leadership. Share experiment results when they are conclusive. Keep the messy middle, the half-formed opportunities and the falsified branches, within the trio. Stakeholders who see an incomplete tree often try to manage it, which kills the learning dynamic.
Before you open a blank canvas, make sure you have:
- A clearly defined outcome tied to an OKR or KPI that your team actually influences
- At least three story-based customer interviews completed (not surveys, not NPS scores, actual conversations where you asked someone to walk you through a recent experience)
- Access to relevant analytics slices so you can ground opportunities in behavioral data, not just anecdote
- A commitment from all three trio members to a weekly cadence, because a tree older than two weeks is likely stale
- Interview notes, transcripts, or timestamped recordings you can reference when someone challenges an opportunity
If you are missing the interviews, stop. Run the interviews first. An OST built from internal assumptions is just a roadmap with extra steps.
How to build an OST from scratch
Follow this sequence exactly. Skipping steps or reversing the order is the single most common reason teams end up with a tree that looks right but functions as a delivery plan.
- Define one measurable outcome. Write it as a behavior metric with a current baseline and a target. One outcome per tree. If your team is working on two outcomes, you need two trees or a clearer mandate.
- Run at least three story-based interviews. Ask customers to walk you through a specific recent experience related to your outcome space. Do not ask what they want. Ask what happened.
- Extract opportunities from the transcripts. Pull direct quotes and paraphrase them as needs, pain points, or desires. Each opportunity should cite the interview it came from.
- Cluster and prioritize opportunities. Group related needs. Then pick one target opportunity to explore deeply. Canonical practice advises limiting work in progress: go deep on one branch before spreading across many.
- Brainstorm multiple solutions for the target opportunity. Diverge first. Aim for at least three candidate solutions before you evaluate any of them. Avoid converging on a single solution in the same session you generated it.
- Identify the riskiest assumption in each candidate solution. Ask: "What would have to be true for this to work?" The answer is your assumption.
- Design the smallest possible experiment. For each riskiest assumption, define: the test format (interview, prototype, fake-door, A/B), the one metric you will measure, and the pass/fail threshold you set before you run it.
- Run the experiment, synthesize results, and update the tree. Add evidence to the relevant branch. Prune branches where the assumption was falsified. Promote solutions that passed their tests toward the backlog.
Pro Tip: Starting with solutions is the most common sequencing failure. When teams jump to solutions before mapping opportunities, they tend to write "opportunities" that are really just restatements of the solution they already want to build. Keep the opportunity layer grounded in customer language, not product language.
For experiments specifically, use this mini-checklist before you run anything:
- Riskiest assumption is written as a falsifiable statement
- Smallest test format chosen (not the most rigorous, the smallest)
- One metric selected, measured before and after
- Pass/fail threshold defined in advance
- Stopping rule set (time-boxed or sample-size-based)
How to prioritize opportunities and pick the right experiments
Not every opportunity deserves the same attention. A useful heuristic: weigh impact (how much moving this opportunity would shift the outcome metric) against confidence (how much interview and behavioral evidence you have) and divide by effort (how hard it is to run a meaningful experiment). You do not need a spreadsheet. A simple high/medium/low rating per dimension, discussed as a trio, is usually enough to surface the obvious winner.
When numbers are not available, lean on evidence density. An opportunity backed by four interview quotes and a behavioral analytics signal beats one backed by a single offhand comment, even if the second one feels more exciting.
Experiment types and when to use them:
Qualitative discovery interviews are the right tool when you are still uncertain whether an opportunity is real. Run them before you build anything. They are cheap, fast, and they frequently reveal that the problem you thought you were solving is not the problem customers actually have.
Prototype tests work once you have a candidate solution and want to know whether customers understand it and would use it. A clickable Figma prototype shown to five customers in a moderated session will tell you more than a month of backlog grooming.
Gated A/B tests belong later, when you have enough traffic to detect a meaningful signal and a solution polished enough to ship to a subset of users. Connecting your OST to an analytics stack like Amplitude lets you map experiment results directly back to the outcome metric, so you can see whether a winning experiment actually moved the number you care about.
Lightweight pilots (a manual version of the feature, a concierge experiment, a wizard-of-oz test) are underused. They let you test the value of a solution before writing a line of code.
On stopping rules: set them before you start. Decide in advance whether you are running for a fixed time period or until you hit a sample size. Changing the stopping rule after you see early results is how teams talk themselves into shipping things that do not work.
How to keep an OST alive week to week
The OST is not a document you create once and revisit quarterly. It is a weekly practice. Without a standing cadence, the tree calcifies. Without weekly interviews, OSTs become static artifacts that reflect what the team believed three months ago.
A weekly trio sync of 45–60 minutes is the minimum viable cadence. Here is a simple agenda:
- Evidence snapshot (10 min): Each trio member shares one thing they learned from an interview or analytics review since last week.
- Branch health check (15 min): Review the active opportunity branch. Are the solutions still the right candidates? Did any experiment results come in? Prune falsified branches.
- Next experiment decision (15 min): Agree on what the trio will test this week. Assign ownership. Confirm the metric and stopping rule.
- Blockers and data needs (5 min): Note anything the trio needs from outside (analytics access, recruiting help, stakeholder input).
Ownership matters. Assign one person, usually the PM, as the tree's steward. That person is responsible for keeping the canvas current, linking interview notes to opportunity cards, and flagging when a branch has gone untouched for more than two weeks. Everyone else on the trio is a contributor, adding evidence and challenging assumptions.
One practical version-control tip: timestamp every opportunity card with the interview date and participant ID. When someone challenges an opportunity six weeks later, you can pull up the exact transcript moment that generated it.
Connecting the OST to your backlog: When an experiment passes its threshold and a solution is ready to build, create a backlog item and link it to the OST branch. But do not let the backlog drive the tree. The moment you start adding OST branches to justify work already in the sprint, the tree has become a roadmap.
Common OST mistakes and how to fix them fast
Most OST failures are process failures, not conceptual ones. The framework is simple. The discipline is hard.
- Treating the OST as a roadmap. Red flag: the tree has no experiments, only solutions with delivery dates. Fix: restore the weekly discovery cadence and add at least one experiment leaf to every active solution branch before the next sync.
- Single-solution branches. Red flag: every opportunity has exactly one solution underneath it. Fix: run a 20-minute brainstorm and generate at least two more candidates before evaluating any of them.
- Opportunities phrased as solutions. Red flag: an opportunity card reads "add a progress bar" instead of "I don't know if I'm doing this right." Fix: rewrite every opportunity in the customer's voice. If it sounds like a feature, it is a solution.
- No interview evidence attached. Red flag: you cannot point to a specific customer conversation that generated an opportunity. Fix: require a citation (interview date, participant, timestamp) for every opportunity card. If you cannot cite it, move it to a "hypothesis" parking lot until you validate it with a real conversation.
- Tree untouched for more than two weeks. Red flag: the last update timestamp is older than your last sprint. Fix: schedule the weekly sync, make it non-negotiable, and treat a stale tree as a team health signal, not just an admin problem.
- Spreading discovery across too many branches at once. Red flag: the trio is running experiments on four different opportunities simultaneously. Fix: pick one target opportunity and go deep. Breadth feels productive; depth generates learning.
OST versus impact mapping, problem trees, and story maps
These tools are not interchangeable. Each one is built for a different job.
| Tool | Primary audience | Primary use case | Best scope |
|---|---|---|---|
| Opportunity Solution Tree | Product trio (PM, designer, engineer) | Continuous, evidence-driven discovery | Weekly, iterative, single outcome |
| Impact Mapping | Cross-functional stakeholders, leadership | Strategic alignment on goals and actor behaviors | Quarterly planning, org-wide initiatives |
| Problem Tree | Researchers, policy teams, analysts | Root-cause analysis of a known problem | Diagnostic, pre-discovery |
| User Story Map | Product team, engineering | Sequencing features for delivery | Sprint and release planning |
The decision rule is straightforward. If you need to align a room full of stakeholders on why you are building something and what behavior change you expect from which actors, impact mapping is the right tool. Impact maps work at the level of goals, actors, impacts, and deliverables. They are excellent for quarterly planning sessions and impact mapping workshops where diverse perspectives need to converge.
If you need a trio-level tool for weekly discovery that connects customer evidence to experiments, the OST is the right choice. The two tools are complementary, not competing. Many teams use an impact map to set the outcome at the top of an OST.
A problem tree is a root-cause diagram, not a discovery tool. It helps you understand why a problem exists, but it does not tell you which solution to test or how to measure progress. A user story map is a delivery sequencing tool. It belongs after you have validated solutions, not before.
Templates, tools, and a worked example you can copy today
Recommended tools:
- Whimsical OST template: a copyable, production-quality worked example that shows multiple solutions per opportunity, evidence attached to branches, and a weekly-update structure. Best for lightweight, fast setup.
- Miro: offers a blank OST canvas with sticky-note layers. Best for teams already running discovery workshops in Miro and wanting to keep everything in one workspace.
- ProductTalk canonical guide: the authoritative written reference for OST structure and practice. Read this before you run your first session.
- ProductPlan glossary: a concise reference for teams who need a quick definition to share with stakeholders unfamiliar with the framework.
Worked example:
Opportunity (from interview): "I finish the setup steps but I'm never sure if everything is actually connected correctly." (Participant 4, interview June 3, timestamp 14:22)
Candidate solutions:
- A real-time connection status indicator visible on the dashboard
- A post-setup checklist with green checkmarks that persist between sessions
Smallest experiment for Solution 1: Show a static mockup of the status indicator to five customers in a moderated session. Ask them to narrate what they think it means and whether it would change their behavior after setup. Pass criteria: at least four of five participants correctly interpret the indicator without prompting.
This is the kind of concrete translation from outcome to experiment that makes an OST useful rather than decorative. The tree does not tell you what to build. It tells you what to learn next.
What the research says about OST best practices
The practitioner consensus on OST is unusually consistent across sources. A few rules show up everywhere:
- Minimum three story-based interviews before mapping opportunities. This is not a soft guideline. Fewer than three interviews means your opportunity space is too narrow to be representative. Every opportunity should cite the interview and timestamp it came from.
- Weekly cadence is non-negotiable. A tree updated less frequently than weekly loses its function as a discovery tool and becomes a status artifact.
- Sequence matters. Outcome first, then opportunities from interviews, then solutions, then experiments. Reversing any step corrupts the tree's logic.
- Evidence citation for every opportunity card. If an opportunity cannot be traced to a specific customer conversation, it is a hypothesis, not an opportunity. Keep hypotheses in a separate parking lot until you can validate them.
Pro Tip: When you add an opportunity to the tree, write the citation directly on the card: interview date, participant pseudonym, and timestamp. Six weeks later, when a stakeholder challenges the branch, you can pull up the exact moment. This one habit separates teams that use OSTs as thinking tools from teams that use them as decoration.
For conducting story-based interviews that generate real opportunity evidence, the key is asking customers to walk you through a specific recent experience rather than asking them what they want. The difference in signal quality is significant.
When OST insights tell you to scale or pivot
An OST does not just tell you what to build next. Over time, the pattern of experiment results tells you something more important: whether you are in the right opportunity space at all.
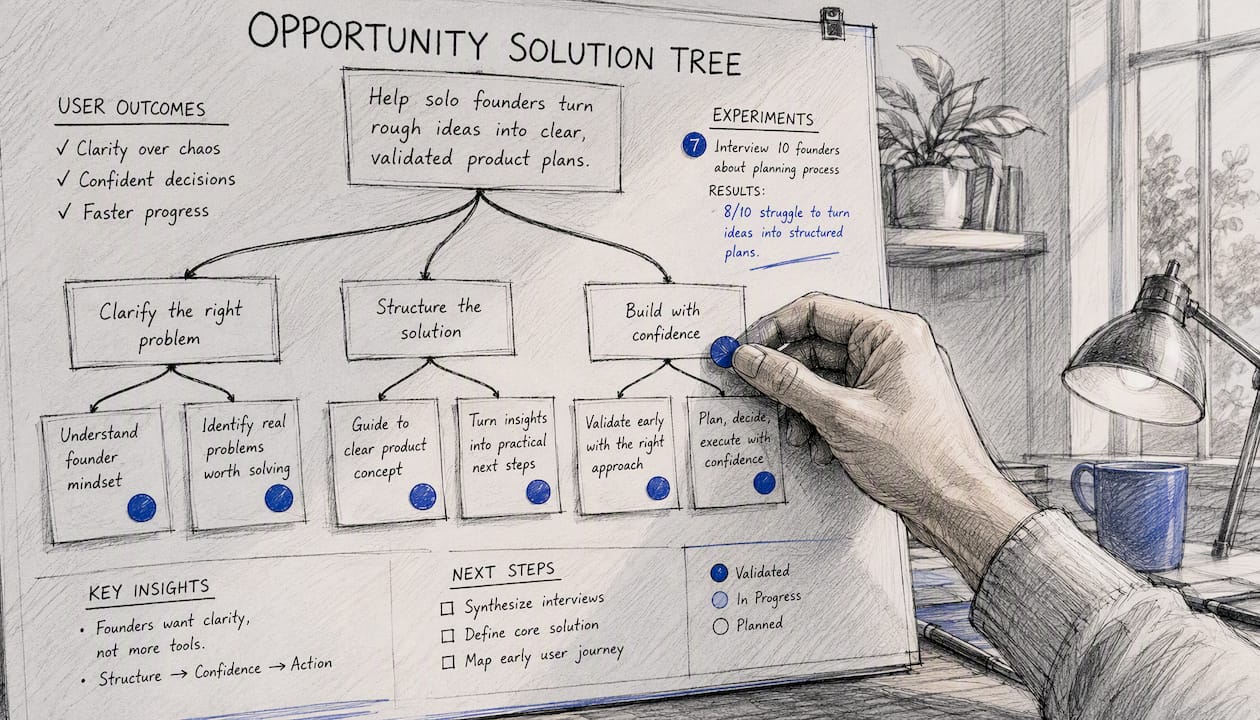
Scaling signals appear when multiple experiments across different solutions for the same opportunity consistently pass their thresholds. That convergence is evidence that the opportunity is real and that your solutions are moving the outcome metric. At that point, the right move is to deepen investment: run more rigorous experiments, increase sample sizes, and begin translating validated solutions into backlog items. The OST branch becomes a delivery candidate.
Pivot signals appear when experiments keep failing despite good execution. If three different solutions for the same opportunity all fail to move the metric, the problem is usually the opportunity itself, not the solutions. The opportunity may be real but not connected to your outcome. Or it may be a symptom of a deeper need you have not surfaced yet. The corrective action is to go back to interviews, not to generate a fourth solution.
A subtler pivot signal: your outcome metric moves, but not because of the experiments you ran. Something else in the product or market shifted it. When that happens, the OST forces a useful question: is the outcome still the right one? Sometimes the answer is no, and the tree needs a new root before the branches make sense.
Connecting your OST to a product analytics tool lets you catch these signals faster. When experiment results flow back into the tree with actual metric data attached, the pattern of what is working and what is not becomes visible across the whole canvas, not just in individual experiment write-ups.
Real-world OST impact: what teams actually report
The most instructive OST case studies are not the ones where everything went smoothly. They are the ones where the tree caught a mistake before it became expensive.
One pattern that shows up repeatedly in practitioner accounts: a team enters an OST session convinced they know the right solution. They have already scoped it, estimated it, and informally committed to it. The OST process forces them to write the opportunity in customer language, and when they do, they realize the solution they planned addresses a different need than the one customers actually described. The tree did not generate a better solution. It revealed that the original solution was answering the wrong question.
A second pattern: teams that maintain a weekly cadence for a full quarter report that their experiment velocity increases over time, not because they get faster at running experiments, but because they get better at identifying the riskiest assumption quickly. The first few experiments tend to be over-engineered. By week eight or ten, the trio has developed a shared instinct for the smallest test that would actually change their decision.
A third pattern, relevant for founders using OST thinking in early-stage work: the tree surfaces opportunity spaces that analytics alone would never reveal. Behavioral data shows you what customers do. Story-based interviews show you why, and the "why" is where the most valuable opportunities live. Teams that combine both, using analytics to identify where users drop off and interviews to understand what is happening in those moments, tend to generate higher-quality opportunity branches than teams that rely on either source alone.
How to read experiment data and update your OST
Running an experiment is the easy part. Interpreting the results honestly is where most teams struggle.
Start with the pass/fail threshold you set before the experiment ran. If the result clears the threshold, the assumption is provisionally validated. Add the result to the branch with a timestamp and move the solution toward the next stage of development or a more rigorous test. If the result does not clear the threshold, the assumption is falsified. Prune the branch or mark it as invalidated and move to the next candidate solution.
Two failure modes to watch for:
Motivated interpretation. The experiment result is ambiguous, and the team interprets it as a pass because they want the solution to work. The fix is to set the threshold in advance and treat it as binding. If the result is genuinely ambiguous, run a smaller follow-up test to resolve the ambiguity, do not declare victory.
Ignoring qualitative signal. A quantitative experiment passes its threshold, but every customer in the moderated session expressed confusion about what the feature was doing. That qualitative signal matters. A metric can pass while the underlying behavior is fragile. Note both in the branch and factor the qualitative finding into the next experiment design.
When you update the tree after an experiment, do three things: record the result with the date, update the branch status (active, validated, falsified), and note what the result implies for adjacent branches. A falsified assumption in one solution often has implications for other solutions targeting the same opportunity. Catching that connection early saves the trio from running redundant experiments.
Pro Tip: Treat each experiment result as a question answered, not a project completed. Write one sentence on the branch that says what you now know and what you still do not know. That sentence is the input to the next experiment.
The OST in practice: a perspective worth considering
The most underrated thing about the opportunity solution tree is what it does to team conversations, not what it does to the product.
Before teams adopt an OST, most product discussions are implicitly about solutions. Someone proposes a feature, someone else pushes back on scope, and the conversation circles around implementation details while the underlying customer need goes unexamined. The OST changes the grammar of those conversations. When every solution on the canvas is visibly connected to an opportunity, and every opportunity is connected to a customer quote, the question "should we build this?" becomes "does this address a real need, and is this the best way to address it?" That is a different conversation, and it produces different decisions.
The cultural resistance to OSTs is almost always about time. Teams say they do not have time for weekly interviews. What they mean is that interviews are not yet protected time. The fix is not to make interviews optional. It is to treat the weekly interview cadence the way you treat sprint planning: a non-negotiable ceremony that the rest of the calendar works around.
One practical adoption tip: start with a single trio, a single outcome, and a single branch. Do not try to OST your entire product at once. Run one branch for four weeks, show the experiment results to leadership, and let the outcomes speak. Teams that try to roll out OSTs org-wide in a single quarter almost always fail. Teams that start small and demonstrate value tend to expand naturally.
Klaritea's approach to early-stage planning reflects the same logic. Before you build anything, you need a clear outcome, a mapped opportunity space, and validated assumptions. The tool you use matters less than the discipline of following the sequence.
Klaritea helps you structure your ideas before you build
Most founders skip the discovery work entirely. They jump from idea to code, spend weeks building, and then discover the problem they solved was not the one customers actually had. Klaritea is built for the moment before that mistake happens.
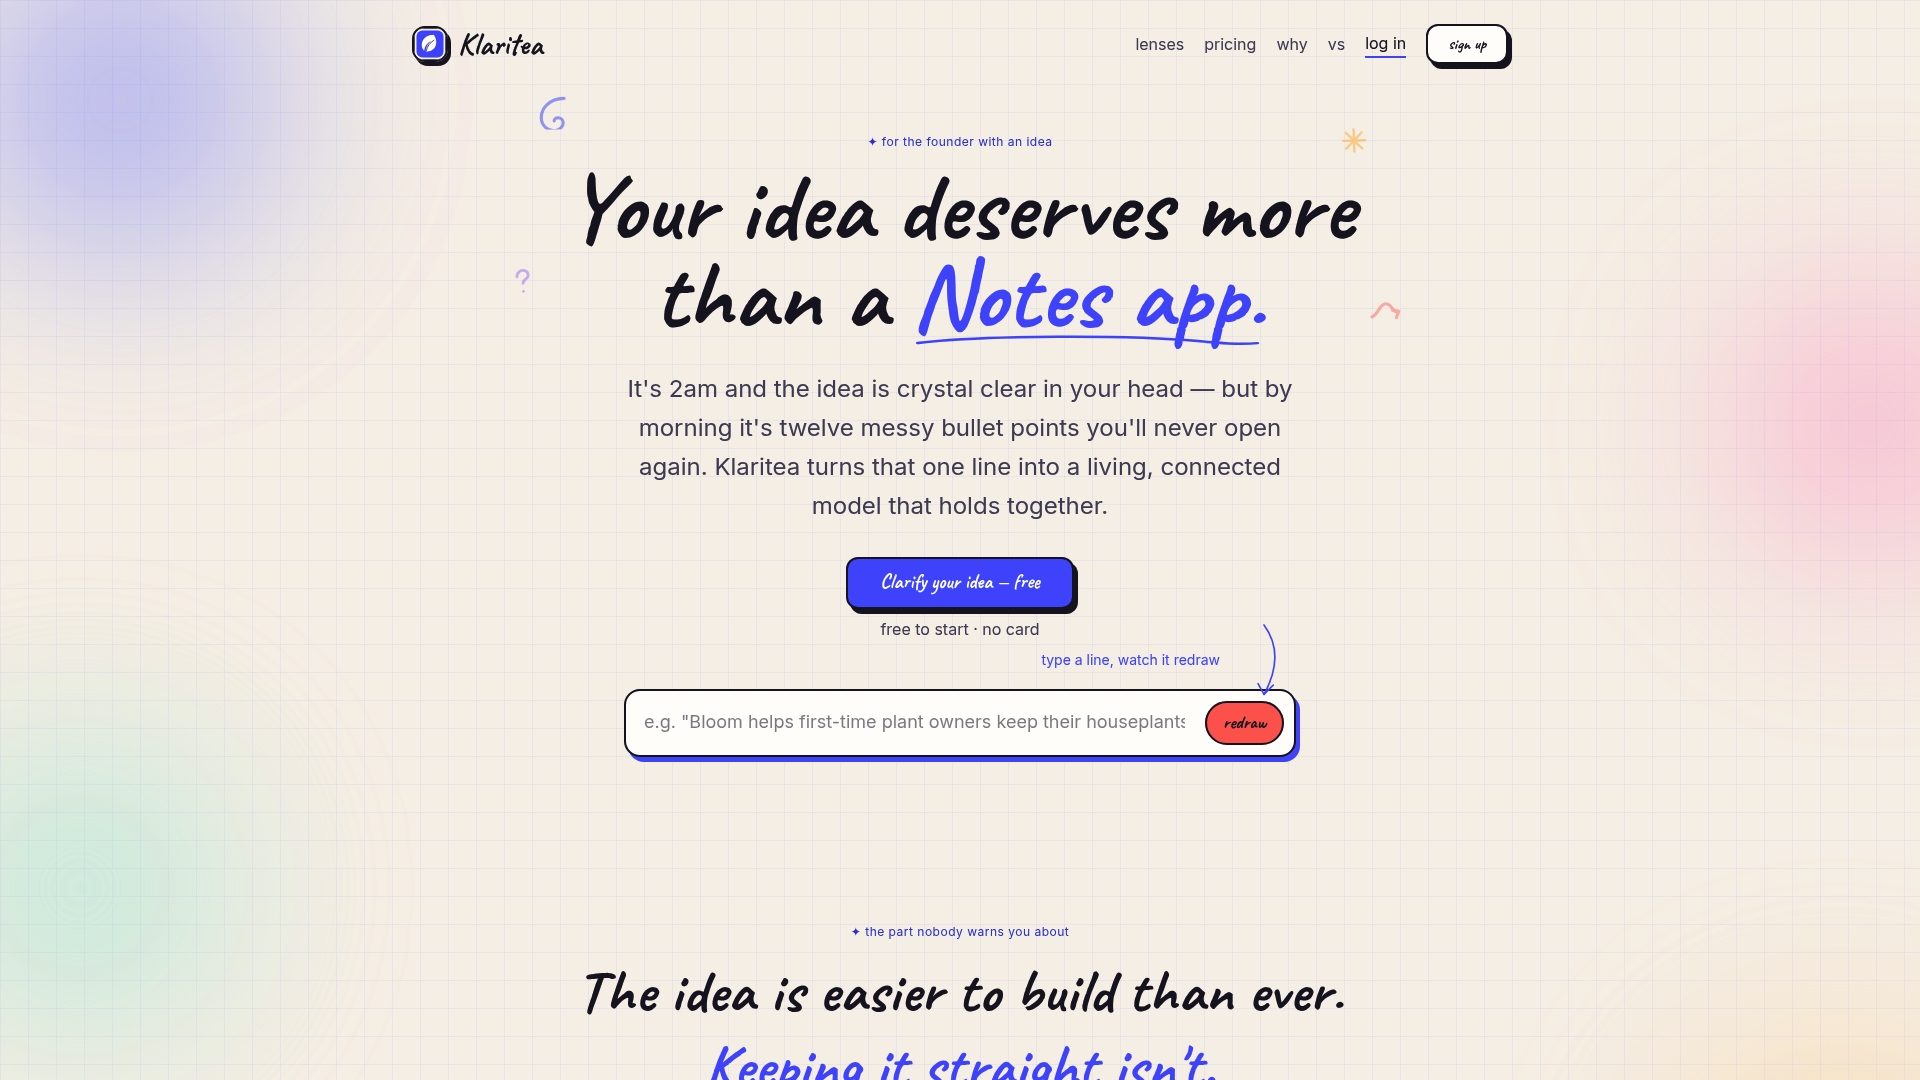
Type a one-line idea into Klaritea and it builds a connected model of your business: ICP, market sizing, competitor landscape, feature map, and a build spec your engineer can actually use. The AI advisory board (Maya, Devon, and Priya) challenges your assumptions the way a good product trio would, before you have spent a dollar on development. If you are using OST thinking to validate an opportunity space, Klaritea gives you the structured output that turns a validated opportunity into an execution-ready plan.
For founders who want to move from fuzzy idea to shipped product without the $15K mistake, Klaritea's connected planning model is the place to start. Try Klaritea and run your first clarity session today.
Sources
- Opportunity Solution Trees: Visualize Your Discovery to Stay Aligned and Drive Outcomes
- Opportunity Solution Tree (Worked Example) | Whimsical
- How to build an opportunity solution tree · Talkful
- Map opportunities and solutions, to drive outcomes (How to use an OST) — Mathias Holmgren
FAQ
What is the difference between impact mapping and an opportunity solution tree?
Impact mapping is a strategic alignment tool for cross-functional stakeholders, connecting business goals to actor behaviors and deliverables. An opportunity solution tree is a trio-level discovery tool that connects a single measurable outcome to customer needs, competing solutions, and experiments, updated weekly as part of continuous discovery.
What is the desired outcome of an opportunity solution tree?
The OST does not produce a shipped feature. Its output is a prioritized, evidence-backed view of which customer opportunity to explore and which experiment to run next, all traceable to a single measurable business outcome.
How do you make an opportunity solution tree?
Start with one measurable outcome, run at least three story-based customer interviews, extract opportunities from those transcripts, brainstorm multiple solutions per opportunity, identify the riskiest assumption in each solution, and design the smallest possible experiment to test it. Update the tree weekly.
What is the difference between a problem tree and a solution tree?
A problem tree is a root-cause analysis diagram that maps why a problem exists. An opportunity solution tree is a discovery tool that maps how to address customer needs in service of a measurable outcome. Problem trees diagnose; OSTs direct discovery and experimentation.
How often should a product trio update their OST?
Weekly. A standing trio sync of 45–60 minutes is the recommended cadence. A tree that has not been updated in more than two weeks is likely stale and no longer functioning as a live discovery tool.