
A North Star Metric (NSM) is the single measurable signal that best captures the core value your product delivers to customers. Every team in your company should be able to look at it and know whether the product is working.
Before you commit to any candidate metric, run it through this quick checklist:
- Does it express customer value directly, not company activity?
- Is it a leading indicator of revenue, not revenue itself?
- Is it unambiguous and measurable with your current instrumentation?
- Can your teams actually influence it through their daily work?
A metric that fails even one of these tests is a key performance indicator at best, not a North Star. The NSM sits above your KPIs and OKRs: it is the single number those instruments are meant to move.
Key Takeaways
A North Star Metric works only when it expresses genuine customer value, leads revenue as a predictive signal, and is owned and understood by every team that can influence it.
| Point | Details |
|---|---|
| Write the statement first | Draft "Our product helps [customer] achieve [outcome]" before picking any number. |
| Filter with six properties | Customer value, leads revenue, measurable, influenceable, simple, right cadence — fail two and drop the candidate. |
| Validate with data and interviews | Run a cohort retention test and interview activated and churned users before committing. |
| Build a driver tree | Map breadth, depth, frequency, and efficiency input metrics so every squad has a lever to pull. |
| Klaritea structures the foundation | Klaritea's connected model gives you ICP, market sizing, and feature clarity before you instrument anything. |
Table of Contents
- Why does a North Star Metric matter for product-led companies?
- What makes a good North Star Metric?
- North Star Metric examples by business type
- How do you choose your North Star Metric?
- How do you validate NSM candidates before committing?
- How do you build a driver tree and run the NSM in production?
- What are the most common North Star Metric mistakes?
- The case for qualitative research before you instrument anything
- Klaritea helps you structure your NSM work from day one
- Sources
- FAQ
Why does a North Star Metric matter for product-led companies?
Most product teams are not short on metrics. They are short on shared metrics. Without a single agreed signal, engineering optimizes for speed, marketing optimizes for signups, and customer success optimizes for ticket closure. Everyone is busy; nobody is aligned.
A well-chosen NSM fixes that by anchoring every team to the same customer outcome. The practical benefits stack up fast:
- Company alignment: one number replaces the weekly debate about which metric matters most.
- Cleaner prioritization: features and experiments that do not move the NSM get deprioritized without a political fight.
- Better experiment design: squads frame hypotheses around the NSM and its input metrics rather than proxy vanity numbers.
- Early warning signals: a dip in the NSM surfaces product problems weeks before they show up in revenue or churn reports.
- Investor clarity: boards and growth investors can track one number instead of a slide deck full of disconnected charts.
Two quick illustrations: Facebook's decision to track daily active users as its NSM gave growth teams a single signal tied directly to habit formation, which correlated tightly with long-term retention. Netflix's focus on time watched per subscriber flagged content fatigue before subscriber churn spiked, giving the content team a lead time to respond.
Pro Tip: When a team can answer "does this help our NSM?" in under ten seconds, meeting time drops and decision speed rises. If that question takes a whiteboard session, the NSM is probably wrong.
What makes a good North Star Metric?
Mixpanel's definition frames it cleanly: a high-quality NSM leads to revenue, reflects customer value, and measures progress. Translating that into a working checklist:
- Expresses customer value. The metric should describe something the customer experiences, not something the company counts.
- Leads revenue, not equals it. Revenue is a lagging outcome. The NSM should predict it.
- Measurable and unambiguous. Two analysts running the same query should get the same number.
- Influenceable by teams. If no squad can move it through their work, it is a vanity signal.
- Simple enough to explain in one sentence. If the definition requires a footnote, it will not align anyone.
- Moves at the right cadence. A metric that only changes quarterly gives teams no feedback loop.
Common failures worth naming: raw revenue fails criterion 1 (it measures company extraction, not customer value). New signups fail criterion 2 (they are a top-of-funnel input, not a value signal). Downloads fail criterion 3 in most mobile contexts because install and activation are different events. Unqualified DAU fails criterion 6 for products with a weekly or transactional natural cadence.
Pro Tip: Write the North Star Statement before you pick the number. "Our product helps [customer] achieve [outcome]" in plain words. Koji's framework calls this 'words before numbers' — the statement surfaces the right metric almost automatically.
One governance rule worth setting early: revisit the NSM only when your core value proposition changes, not when a quarter goes badly. Changing it annually or more often destroys the organizational memory the metric is supposed to build.
North Star Metric examples by business type
The right NSM depends on your product's natural value cadence. Sean Ellis's practitioner work shows how Facebook landed on DAUs and Uber on weekly trips — both choices reflect the frequency at which customers expect to get value, not the frequency that looks best in a board deck.
| Business type | Recommended NSM | Why it works | Watch out for |
|---|---|---|---|
| Consumer social / gaming | Daily active users (DAU) | Daily habit = core value cadence | DAU inflated by notifications, not genuine use |
| Streaming / media | Time watched or time listened per subscriber | Engagement predicts renewal | Autoplay can inflate without real satisfaction |
| Marketplace (two-sided) | Completed transactions or nights booked | Value only realized at transaction | GMV hides low-value or refunded transactions |
| SaaS collaboration | Core action per active team per week (e.g., messages sent, docs created) | Measures team adoption, not just logins | Power users can mask low breadth |
| Freemium productivity | Weekly active users completing core workflow | Activation quality over raw MAU | Free-tier users may never convert |
| Ecommerce | Purchases per active customer per period | Repeat purchase = proven value | Discounting can inflate without margin health |
A few named examples worth anchoring:
- Facebook: DAUs captured habit formation better than MAUs, which could include dormant accounts.
- Netflix: time watched per subscriber tied content investment directly to retention risk.
- Zoom: meetings hosted per active account reflects the collaboration value the product promises.
- Medium: total reading time surfaces whether content is actually consumed, not just clicked.
- Intercom: active conversations per account measures whether support value is being delivered.
- Duolingo: daily active learners with a streak reflects the retention-centric model the product is built around.
Pick the NSM that matches your product's natural value cadence. A weekly-use product tracking DAU will always look broken.
How do you choose your North Star Metric?
Start with a sentence, not a spreadsheet. The GrowthMethod framework recommends writing a one-sentence North Star Statement first: "Our product helps [customer] achieve [outcome]." That sentence almost always contains the metric.
Step-by-step selection process:
- Identify your "must-have" customers. Interview 5–10 users who would be very disappointed if your product disappeared. Their language describes the value you are measuring.
- Generate 3–5 metric candidates. Each should map directly to the outcome in your North Star Statement.
- Filter with the six properties. Run each candidate through the checklist in the previous section. Eliminate any that fail two or more criteria.
- Test measurability. Can you compute each surviving candidate today with your current data stack? If not, is instrumentation feasible within 30 days?
- Confirm team influence. For each candidate, name three specific product or growth changes that would move it. If the team draws a blank, the metric is not influenceable.
- Select and socialize. Present the finalist to engineering, marketing, and leadership. If they cannot explain it back in one sentence, simplify.
A sample candidate and its filter result: "Weekly teams sending at least one message." This passes customer value (messaging = collaboration value delivered), leads revenue (teams that message retain and expand), is measurable (a single SQL query), is influenceable (onboarding flows, notification design, template libraries), and moves weekly. It passes. Compare that to "monthly revenue per account" — it fails criterion 1 (company extraction) and criterion 2 (lagging, not leading). Drop it.
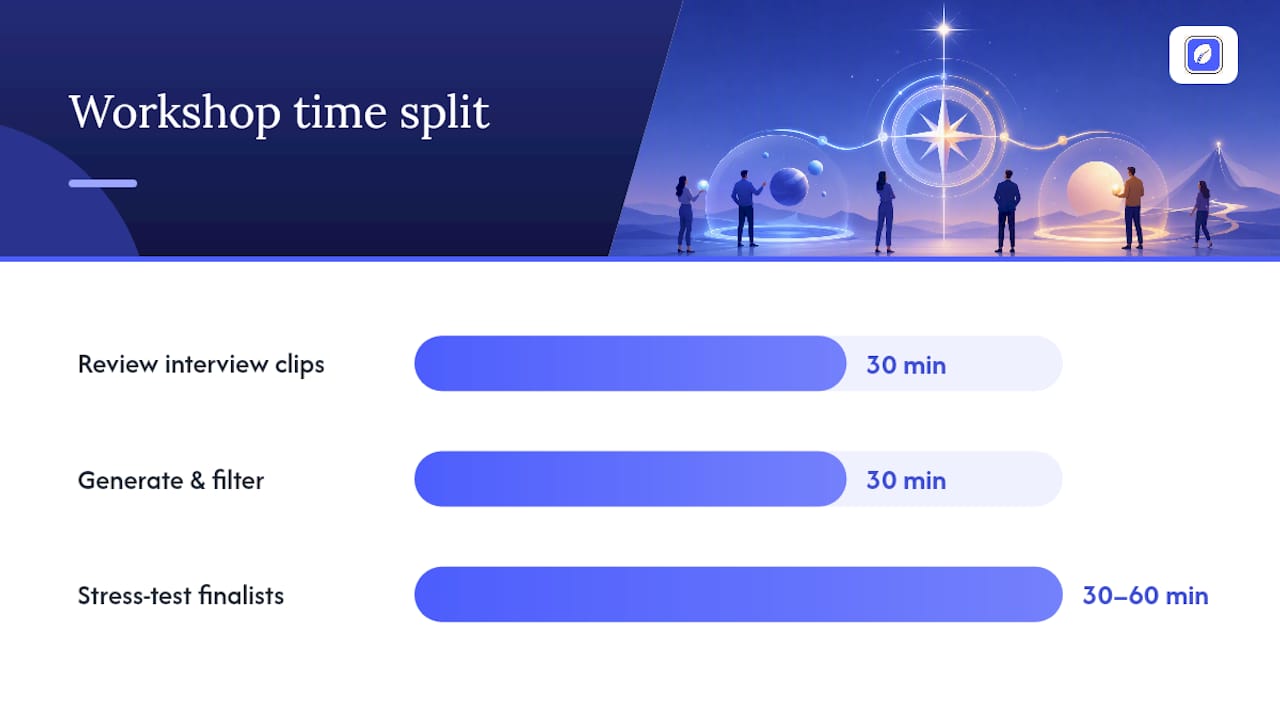
Workshop format: a 90–120 minute session works well. Spend the first 30 minutes reviewing customer interview clips or survey data, 30 minutes generating and filtering candidates as a group, and the final 30–60 minutes stress-testing the top two against the six properties and agreeing on input metrics. Roles: PM facilitates, data analyst prepares the correlation data in advance, growth lead owns the input-metric mapping, and an engineering lead confirms instrumentation feasibility.
How do you validate NSM candidates before committing?
Choosing feels good. Validating is where most teams skip steps. Amplitude recommends testing candidates for leading-indicator behavior and team influenceability before locking in, and Resources.Rework adds the requirement to test historical correlation against retention and revenue.
Validation checklist:
- Historical correlation with 6–12 month retention and LTV data.
- Leading vs. lagging behavior: does the metric move before revenue changes, or after?
- Susceptibility to gaming: can a team inflate it without delivering real customer value?
- Instrumentation completeness: is the event tracked cleanly, with no sampling or gaps?
- Qualitative confirmation: do customers describe the behavior the metric captures as the moment they got value?
Cohort test recipe:
Split your user base into cohorts by whether they hit the candidate NSM threshold in their first two weeks. Compare 90-day retention and LTV across cohorts. Pseudocode:
cohorts = users.group_by(hit_nsm_threshold_in_week_1_2)
for cohort in cohorts:
    retention_90d = cohort.retention_at(90)
    ltv_90d = cohort.avg_ltv_at(90)
compare(cohorts)
If the cohort that hits the threshold retains and monetizes significantly better, the candidate has predictive validity. If the gap is small or reversed, the metric is not capturing real value.
Correlation matrix: run a Pearson or Spearman correlation between weekly NSM candidate values and 90-day retention for the same cohort. A strong positive correlation (above 0.6) is a good signal. Below 0.3 is a red flag.
For sample size: you need enough cohorts to see stable retention curves. Qualitatively, fewer than a few hundred users per cohort makes the signal noisy; treat results as directional, not definitive.
Qualitative step: interview activated users, churned users, and your highest-LTV cohort. Ask each group: "What was the moment you knew this product was working for you?" If their answers consistently describe the behavior your candidate metric captures, you have qualitative confirmation. If they describe something else, revise the candidate.
Pro Tip: When instrumentation is incomplete, use a short-term proxy metric that you can track cleanly today, and instrument the real NSM in parallel. Commit to switching when the real metric has 60 days of clean data.
| Validation test | What it checks | Pass signal |
|---|---|---|
| Historical cohort retention | Predictive validity | High-NSM cohort retains better at 90 days |
| Correlation matrix | Statistical relationship to revenue/LTV | Correlation above 0.6 |
| Gaming audit | Metric integrity | No obvious inflation path without real value |
| Instrumentation review | Data quality | Clean event tracking, no sampling gaps |
| Customer interviews | Qualitative alignment | Users describe the NSM behavior as their value moment |
How do you build a driver tree and run the NSM in production?
The NSM alone does not tell teams what to do. The input-metric tree does. Structure it around four dimensions:
- Breadth: how many customers reach the NSM threshold? (acquisition and activation)
- Depth: how intensely do they engage? (feature adoption, session depth)
- Frequency: how often do they return? (retention, habit cadence)
- Efficiency: how quickly do they reach value? (time-to-value, onboarding completion)
Each dimension generates 1–2 input metrics that ladder directly to the NSM. A collaboration SaaS might look like: NSM = weekly teams sending at least one message. Input metrics: teams completing onboarding (breadth), average messages per active team (depth), weekly return rate (frequency), median time from signup to first message (efficiency).
Ownership model:
| Role | Responsibility |
|---|---|
| Product Manager | Owns NSM definition, reviews weekly, flags anomalies |
| Growth Lead | Owns breadth and efficiency input metrics |
| Data Analyst | Builds and maintains dashboards, runs correlation checks |
| Engineering | Instruments events, maintains data pipeline integrity |
| Customer Success | Owns qualitative signals, surfaces churn-risk accounts |
Reporting cadence: daily and weekly signals go to squads (input metrics, experiment results). Monthly focus metrics go to product and growth leadership. Quarterly and annual guardrail reviews go to the board. This hierarchy, recommended by Mixpanel's framework, prevents the NSM from becoming a board-only vanity number while keeping squads from drowning in noise.
Guardrails: set floor thresholds on input metrics so teams cannot game the NSM by sacrificing one dimension. If breadth spikes but depth collapses, the NSM number may look fine while the product is actually degrading. Log every experiment that touches an input metric. When the NSM moves unexpectedly, run a funnel diagnostic across all four dimensions, then schedule customer interviews within 48 hours.
What are the most common North Star Metric mistakes?
Most NSM failures are predictable. Amplitude's analysis and practitioner post-mortems point to the same patterns:
- Picking revenue or signups as the NSM. Revenue is a lagging output; signups measure intent, not value delivered. Both fail the customer-value test.
- Choosing a metric teams cannot influence. If no squad can name three experiments that would move it, it is not an NSM — it is a business outcome.
- Changing the NSM too often. Switching annually or after a bad quarter destroys the historical baseline and confuses teams. Change it only when the core value proposition shifts.
- Using a gameable metric. If a team can inflate the number without delivering real value (e.g., sending automated messages to hit a "messages sent" target), the metric will be gamed.
- Poor instrumentation. A metric you cannot compute reliably is worse than no metric — it creates false confidence.
- Skipping qualitative validation. Dashboards show correlation; customer interviews explain causation. Teams that skip interviews often discover their NSM measures a proxy behavior, not the actual value moment.
Three red flags your NSM is broken:
- The metric moves but customer satisfaction scores or NPS do not follow.
- Teams regularly debate what the number means in sprint planning.
- The same behavior keeps appearing in experiments designed to inflate it without genuine product improvement.
When teams catch these signals, the corrective path is consistent: freeze the metric, run a fresh round of customer interviews, recheck the historical correlation, and either redefine the metric or fix the instrumentation before resuming growth work.
The case for qualitative research before you instrument anything
The conventional NSM playbook starts with data. Pull your event logs, run a correlation matrix, find the metric most predictive of retention, and call it your North Star. That approach is faster, and it is often wrong.
Data tells you what users do. It does not tell you why, or whether the behavior you are measuring is the one they actually care about. A team that instruments first and interviews later frequently discovers their NSM captures a side effect of value, not value itself. Messaging volume in a collaboration tool might correlate with retention because high-retention teams happen to message a lot, not because messaging is the mechanism. The real driver could be document co-editing, which the team never instrumented because the correlation matrix did not flag it.
Koji's framework and Resources.Rework's method both prescribe qualitative research before instrumentation for exactly this reason. Interview your best customers first. Ask them to describe the moment the product became indispensable. That moment is your NSM candidate. Then go validate it quantitatively.
The other thing practitioners underestimate: the NSM is an organizational commitment, not just a technical choice. A metric that the data team loves but the sales team cannot explain will never align anyone. The "words before numbers" discipline forces the team to agree on the customer outcome in plain language before arguing about which SQL query captures it. That conversation is harder than running a correlation matrix, and it is the one that actually matters.
Klaritea helps you structure your NSM work from day one
Picking a North Star Metric is a planning problem before it is a data problem. You need a clear picture of your customer, your market, and your product's core value proposition before you can write a defensible North Star Statement.

Klaritea builds that picture from a single line of input. Type your idea, and Klaritea generates a connected model covering your ICP, TAM/SAM/SOM, feature map, and build spec, with AI advisors (Maya, Devon, and Priya) challenging your assumptions at each step. That connected model gives you the customer-value language you need to write a North Star Statement that holds up under scrutiny, and the structured output you can export to Notion or Confluence for your team to work from. When you are ready to move from planning to building, the Klaritea workspace gives you the clarity scorecards and metric trees to operationalize the NSM without starting from a blank page. Start with a free plan and see how far one structured idea takes you.
Sources
- Finding the Right North Star Metric | by Sean Ellis | Growth Hackers | Medium
- What is a North Star metric? | Signals & Stories
- Resources
- What Makes a Good vs Bad North Star Metric
- North Star Metric: Definition, Framework & Examples | Growth Method
- north-star-metric-framework
FAQ
What is the difference between a KPI and a North Star Metric?
A KPI (key performance indicator) measures performance on a specific function or team goal; a North Star Metric is the single company-wide signal that captures core customer value and predicts long-term revenue. KPIs ladder up to the NSM — they do not replace it.
What is Netflix's North Star Metric?
Netflix has used time watched per subscriber as its primary success metric, because sustained viewing predicts renewal and reflects whether content is delivering genuine value to subscribers.
How often should you change your North Star Metric?
Change it only when your core value proposition shifts, not in response to a bad quarter or a new feature launch. Amplitude's guidance is clear: changing the NSM too often destroys the historical baseline teams need to make decisions.
Can a startup use a North Star Metric before product/market fit?
Before PMF, a single NSM is usually premature. Use a stage-appropriate One Metric That Matters (OMTM) instead, and graduate to a full NSM once you have identified a stable, repeatable customer value moment.
How many input metrics should ladder to the NSM?
Three to five input metrics is the practical range, organized around breadth, depth, frequency, and efficiency. Fewer than three and teams lack enough levers; more than five and focus collapses.