
The Kano model sorts product features into five categories based on how each one influences customer satisfaction, so teams can tell delight drivers from baseline expectations before they build. Its primary job is simple: reveal which features create genuine satisfaction, which merely prevent complaints if missing, and which might actively annoy people the more you invest in them.
This matters because most roadmaps get built on opinion. A stakeholder likes a feature, so it ships. The Kano model replaces that guesswork with a structured survey and a scoring method that tells you, in numbers, what customers actually reward.
Here's what you'll walk away with:
- How to identify each of the five Kano categories with real product examples
- The exact two-question survey format and how to build one
- Both discrete and continuous analysis, including CS+ and CS- formulas
- A worked example you can copy for your next research cycle
Key Takeaways
The Kano model works because it separates features that prevent dissatisfaction from those that create genuine delight, using a two-question survey and CS+/CS- scoring to make the difference measurable.
| Point | Details |
|---|---|
| Five categories drive decisions | Must-be, Performance, Attractive, Indifferent, and Reverse each demand a different roadmap treatment. |
| Two-question survey is standard | Pair a functional and dysfunctional question per feature, scored on a five-point response scale. |
| CS+ and CS- quantify impact | Calculate both coefficients to plot features on a satisfaction-versus-dissatisfaction diagram. |
| Rerun every 12 to 18 months | Delighters migrate toward expectations, so SaaS teams should refresh studies on that cadence. |
| Klaritea structures the output | Founders can carry Kano categories and CS scores straight into a build spec and market-sizing model inside Klaritea. |
Where to Take Your Kano Results Next
Running a Kano study answers what to build. It doesn't automatically tell you how that feature fits your market size, your competitors, or the spec an engineer needs to start coding. That gap between research and a buildable plan is where most founders lose momentum, and it's often where the $15,000 in wasted vibe-coding spend actually starts.
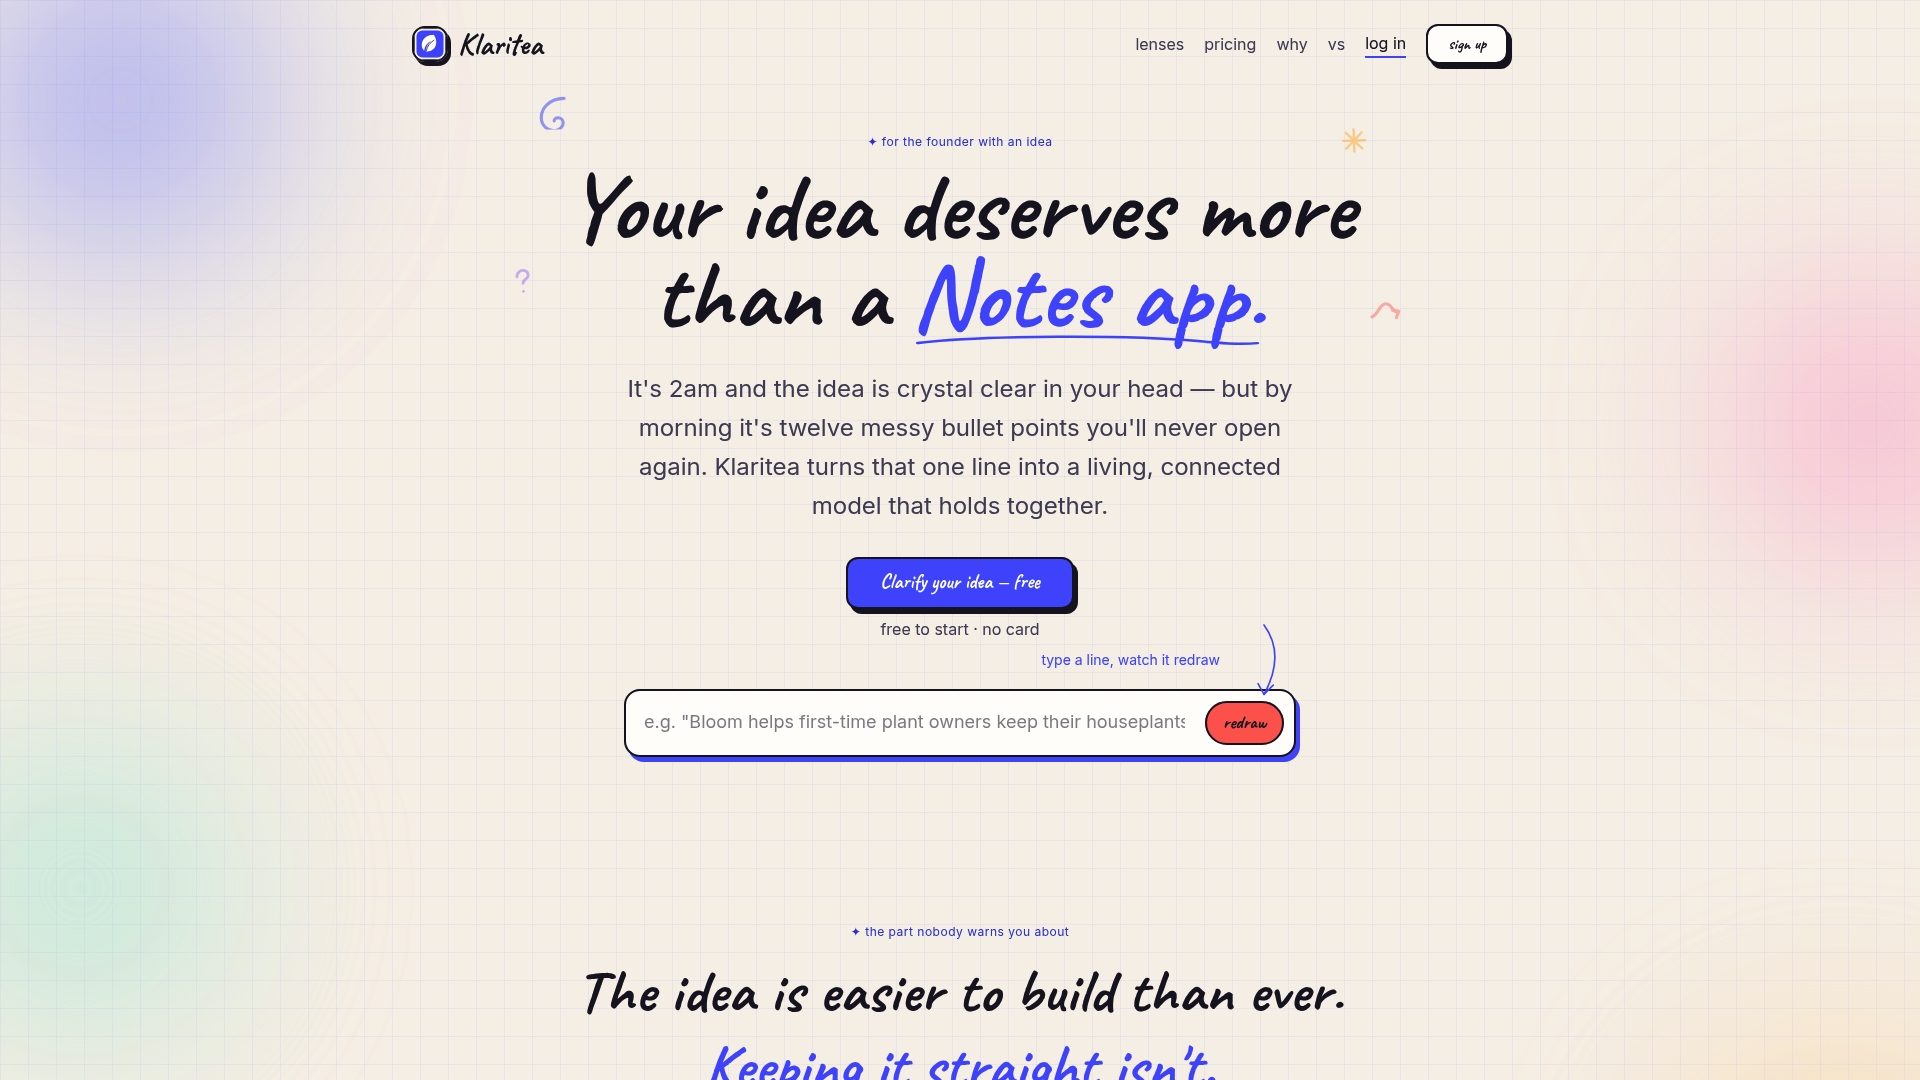
Klaritea is built for exactly that gap. Feed your Kano categories and CS+/CS- scores into it, and it maps them against a connected model of your business: your ICP, TAM/SAM/SOM sizing, competitor set, and a feature backlog with the requirements attached. Instead of a spreadsheet of categories sitting disconnected from your market data, you get one structured view that turns Must-be gaps into build-spec line items and Attractive features into pitch bullet points. If you're deciding what to build after your first Kano study, start with a one-line idea at Klaritea and see the connected model it generates before you write a line of code.
Table of Contents
- What Are the Five Kano Model Categories?
- How Do You Design a Kano Questionnaire?
- How Do You Analyze Kano Survey Results?
- How Do You Apply Kano Results to Your Roadmap?
- A Worked Kano Example You Can Copy
- What Goes Wrong When Teams Use the Kano Model
- Sources
- FAQ
What Are the Five Kano Model Categories?
Every feature you evaluate falls into one of five buckets, and where it lands changes how you should treat it on your roadmap. The Kano model categorizes features according to the relationship between how much you invest in them and how much satisfaction they generate.
Must-be features are the ones customers assume exist. Password reset for a SaaS login is a good example. Nobody praises you for having it, but its absence causes real frustration.
Performance features scale linearly. The faster your app loads, the happier users get, and the relationship holds in both directions. Storage limits on a file-sharing tool work the same way.
Attractive features are the surprises. A project management tool that auto-generates a status update from your task history delights people precisely because they didn't expect it.
Indifferent features move the needle for nobody. A dark mode toggle buried three settings menus deep often falls here, not because dark mode is unpopular, but because the placement made it invisible.
Reverse features actively backfire. Onboarding tours that force every new user through eight tutorial screens frequently produce this effect. Power users hate them; the more elaborate the tour, the worse satisfaction gets.
- Must-be: absence causes dissatisfaction, presence is barely noticed
- Performance: satisfaction rises proportionally with quality or capability
- Attractive: unexpected features that create outsized delight
- Indifferent: no measurable effect on satisfaction either way
- Reverse: satisfaction drops as the feature gets more elaborate
Categories don't stay fixed. Delighters tend to age into expectations as competitors copy them, which is why a feature that wowed users in 2023 might be a bare must-be by 2026.
Pro Tip: Before you invest heavily in an "attractive" feature, check whether a competitor already shipped something similar. If they did, it may have already migrated toward performance or must-be in your customers' minds.
How Do You Design a Kano Questionnaire?
Every Kano study runs on a standardized two-question format applied to each feature you want to test. Get the phrasing right and the rest of the analysis follows cleanly.
- Write the functional question. Ask how the respondent would feel if the feature were present: "How do you feel if [the product] includes automatic invoice reminders?"
- Write the dysfunctional question. Ask the mirror version: "How do you feel if [the product] does NOT include automatic invoice reminders?"
- Add an optional importance question. A simple 1 to 5 rating on how much the feature matters helps you weight features that fall into similar categories.
- Fix the response scale. Qualtrics recommends five standard options: "I like it," "I expect it," "I am neutral," "I can live with it," and "I dislike it."
- Randomize the block order. Don't present every functional question followed by every dysfunctional one. Mix feature blocks so respondents don't anticipate the pattern.
A few things to get right before you launch:
- Test your phrasing on 5 to 10 people first. Ambiguous feature descriptions ruin classification before the study even starts.
- Segment your sample by user type (new vs. tenured, free vs. paid) since categories often diverge by segment.
- Aim for a sufficient number of responses per segment for discrete analysis to hold up; smaller samples call for qualitative follow-up interviews to fill the gaps.
- Use a survey tool that supports block randomization and anonymized responses. Get explicit consent if you're collecting any identifying data alongside satisfaction ratings.
- Mix quantitative surveys with a handful of qualitative interviews. The GitLab product research team uses this pairing specifically to explain surprising or contradictory classifications.
How Do You Analyze Kano Survey Results?
Two methods turn raw responses into usable categories, and most teams end up using both.
Discrete analysis maps each respondent's functional and dysfunctional answers onto a standard evaluation table. Cross a "like it" functional response with a "dislike it" dysfunctional response and you land on Performance. Cross "like it" with "I expect it" and you land on Attractive. The evaluation table itself is fixed. Any combination that logically shouldn't occur, such as liking both the presence and absence of a feature, gets flagged as "questionable" and either excluded or investigated separately.
Continuous analysis replaces categories with numbers, typically scoring responses on a scale from negative 2 to positive 4. This captures nuance discrete counts miss, since continuous scoring surfaces high-impact but low-frequency preferences that a simple majority vote would bury.
The real payoff comes from the satisfaction coefficients:
- CS+ (satisfaction coefficient) = (Attractive + Performance) / (Attractive + Performance + Must-be + Indifferent)
- CS- (dissatisfaction coefficient) = negative (Performance + Must-be) / (Attractive + Performance + Must-be + Indifferent)
CS+ and CS- together turn five qualitative buckets into two numbers you can plot on an X/Y chart, with CS+ showing satisfaction potential and CS- showing dissatisfaction risk if the feature is missing. This scoring approach is the mechanism practitioners rely on for QFD input and roadmap prioritization.
Aggregate results by segment before you average across your full sample. A feature that reads as Indifferent overall can hide a strong Performance signal in one user segment and a flat response in another.
How Do You Apply Kano Results to Your Roadmap?
Kano data only earns its keep once it changes what you build. Run the categories through a fixed sequence rather than tackling whatever feels urgent that week.
Start with must-be gaps. If your evaluation table shows a must-be feature missing or broken, fix it before anything else, since its absence caps satisfaction regardless of what else you ship. Next, invest in performance features with a high CS- score. These are the ones where falling short costs you the most, so they deserve real engineering time in the current cycle. Then, and only then, layer in a small number of attractive features chosen for strategic differentiation or expected revenue lift, not because they're fun to build.
- Weigh implementation cost and business impact alongside the Kano signal. A must-be feature that costs six months of engineering time might still get sequenced behind a cheaper Performance fix with comparable urgency.
- Fold Kano categories directly into QFD or your release planning process. Must-be and high-CS- Performance items typically belong in v1; most Attractive features can wait for a later release once the foundation holds.
- When segments disagree, don't average the disagreement away. A feature that's Performance for enterprise users and Indifferent for free users usually means you need two different roadmaps, not one compromise feature.
Pro Tip: Turn your CS+/CS- scores into a plain feature backlog before your next planning meeting, then attach a rough cost estimate next to each item. That turns an abstract Kano chart into something a non-researcher on your team can act on immediately.
For teams translating this into formal specs, a feature requirements document is the natural next artifact once your Kano categories are set.
A Worked Kano Example You Can Copy
Say you're testing a feature for a project management tool: automatic deadline risk alerts that flag tasks likely to slip before they're overdue.

Functional question: "How do you feel if the tool automatically flags tasks at risk of missing their deadline?" Dysfunctional question: "How do you feel if the tool does NOT flag tasks at risk of missing their deadline?"
Suppose you survey 40 users and get this distribution:
| Response Combination | Count | Kano Category |
|---|---|---|
| Like functional / Dislike dysfunctional | 14 | Performance |
| Like functional / Expect dysfunctional | 9 | Attractive |
| Neutral functional / Live with dysfunctional | 8 | Indifferent |
| Expect functional / Dislike dysfunctional | 7 | Must-be |
| Dislike functional / Like dysfunctional | 2 | Questionable |
To calculate the coefficients:
- Sum Attractive and Performance: 9 + 14 = 23. Divide by total valid responses (38, excluding the 2 questionable): CS+ = 0.61
- Sum Performance and Must-be: 14 + 7 = 21. Divide by 38 and flip the sign: CS- = negative 0.55
That combination, high CS+ and high (negative) CS-, places deadline risk alerts near the top right of your Kano diagram: strong upside if you build it well, real downside if you skip it.
For continuous scoring, ask respondents to rate their reaction from negative 2 (strong dislike) to positive 4 (strong like) instead of picking a category, then average the scores per feature to rank them against each other. A simple template block covering feature description, functional question, dysfunctional question, and importance rating, repeated for each feature, works in any standard survey tool that supports randomized question blocks.
What Goes Wrong When Teams Use the Kano Model
Kano is reliable when you run it carefully and unreliable when you rush the setup. A handful of mistakes account for most bad results, so many teams turn to Solano Advisory Group's expert services for help running Kano research or converting findings into go-to-market plans.
- Vague feature descriptions produce noisy answers. "Improved search" means something different to every respondent. Pilot-test phrasing with a handful of users before the full launch.
- Small or skewed samples make categories look more certain than they are. If your segment has fewer than 20 responses, treat the category as a hypothesis and follow up with interviews.
- Feeding raw Kano categories into QFD without adjusting for asymmetry overweights must-be features that customers won't reward but can't build cost estimates against.
- Kano tells you what matters to satisfaction, not what's cheap or fast to build. Pair it with RICE or MoSCoW scoring once categories are set, so cost and effort enter the decision explicitly.
When Should You Rerun a Kano Study?
Feature categories drift as markets move, so a study from two years ago may no longer reflect what customers expect today. In fast-moving categories like SaaS, rerun the full study every 12 to 18 months; slower-moving industries can stretch that further.
- Rerun after a major UX overhaul, a new competitor launch, or a regulatory shift that changes baseline expectations
- A quick pulse survey or a handful of targeted interviews can substitute for a full study when you only need to check one or two features
Turning Kano Results Into Phase-Zero Planning Artifacts
A Kano study is most useful when its output feeds directly into the documents you use to plan a build, not when it sits alone in a slide deck.
- Define your target segments and shortlist candidate features before you survey anyone
- Run the study, compute CS+/CS- coefficients, then map results straight into your build spec and TAM/SAM/SOM sizing
- Validate top-ranked features with a rough prototype before committing engineering time
Pro Tip: Keep a running log of which category each feature lands in across studies. That history becomes your evidence when a stakeholder pushes for a feature Kano already flagged as Indifferent.
A Founder's Take on Getting Started This Week
Skip the elaborate study your first time out. Pick five candidate features, run a single Kano block with 30 users, and act only on what the must-be results tell you. When you present to stakeholders, lead with the CS+/CS- numbers, not the raw category labels. Numbers get budget approved; labels get debated.
Sources
For deeper reading, Qualtrics covers the model's origin and categories in depth. ProductPlan walks through the research-to-roadmap workflow. SI Labs offers a practical questionnaire template and cadence guidance. The GitLab Handbook shows how one product organization runs Kano surveys in practice.
- Kano analysis: The kano model explained
- How to Use the Kano Model to Prioritize Features | ProductPlan
- Kano Model: Guide, Practical Example & Questionnaire Template | SI Labs
- Scholarly summary of Kano uses and continuous analysis (NUS repository)
FAQ
What Are the Five Requirements of the Kano Model?
The Kano model uses five feature categories, Must-be, Performance, Attractive, Indifferent, and Reverse, each defined by how satisfaction changes as the feature's functionality increases or decreases.
What Are the Limitations of the Kano Model?
Kano results depend heavily on question phrasing and sample size, can misclassify features with small or biased samples, and don't account for implementation cost, which is why teams pair Kano with frameworks like RICE or MoSCoW before finalizing a roadmap.
Who Developed the Kano Model?
Professor Noriaki Kano developed the model in 1984 at the Tokyo University of Science as a way to categorize features by the relationship between investment and customer satisfaction.
How Does the Kano Prioritization Technique Work?
Teams survey customers with paired functional and dysfunctional questions per feature, classify responses using discrete or continuous analysis, then compute CS+ and CS- coefficients to rank features by satisfaction and dissatisfaction impact before sequencing them on a roadmap.
How Often Should You Rerun a Kano Study?
Rerun a full Kano study every 12 to 18 months in fast-moving markets like SaaS, since delighters tend to migrate into baseline expectations, and rerun sooner after a major UX overhaul or a significant competitor launch.