Business model mapping is the practice of laying out how a venture creates, delivers, and captures value on a single page, treated as a hypothesis rather than a finished plan. The immediate next step is simple: build one canvas, pick your top three risky assumptions, and design one low-cost test for each. This guide walks through the prompts, templates, and version-control habits that make that process stick.
TL;DR:
- Keep mapping sessions to four to six people, include customer, operations, and decision making perspectives, and timebox each canvas block to 10 minutes.
- Rank assumptions by desirability, feasibility, and viability, prioritizing those with little evidence and high dependence because failure there can undermine the model.
- Test the top two or three assumptions with low cost experiments lasting one to four weeks, and set measurable success thresholds before each test.
- Update the canvas weekly early on and monthly once the model stabilizes, keeping dated versions and separating entries with evidence from speculation.
Table of Contents
- What the Business Model Canvas is and why its nine blocks matter
- Preparing to map: who to involve and what to gather first
- Step-by-step mapping workflow: prompts and outputs for each canvas block
- From map to experiments: converting assumptions into tests
- Business model patterns and strategic mapping for innovation
- Tools, templates, and a practical option for operationalizing mapping
- Two short mapping case sketches
- What phase-zero planning actually teaches founders
- Try business model mapping with Klaritea
- FAQ
- Sources
What the Business Model Canvas is and why its nine blocks matter
The Business Model Canvas is the standard tool for this work: a one-page framework built around nine building blocks that together describe how a business operates. The right side covers market and value (who you serve and what you offer them), while the left side covers resources and efficiency (what it takes to deliver).
- Customer segments: the groups of people or organizations you aim to reach
- Value propositions: the specific problems you solve or needs you satisfy
- Channels: how you reach customers and deliver value to them
- Customer relationships: the type of relationship you build and maintain with each segment
- Revenue streams: how and from what each segment generates income
- Key resources: the assets required to make the model work
- Key activities: the most important things you must do well
- Key partnerships: the outside relationships that make the model possible
- Cost structure: the costs that drive the model, and which ones matter most
Most founders treat the canvas as a static plan, filled in once and filed away. A better habit is to treat it as a dashboard of hypotheses, something you revisit every time new evidence arrives. Strategyzer's official canvas template, built by Osterwalder and Pigneur, is designed for exactly this: a dated, versioned document you expect to change.
Preparing to map: who to involve and what to gather first
A mapping session only produces useful output when the right people and the right facts show up in the room.
- Invite a founder or product lead who owns the final decisions.
- Bring someone close to the customer, whether that is sales, support, or whoever has done the interviews.
- Add a person who understands costs and operations, even informally.
- Keep the group small, four to six people works better than a crowd.
Before the session, gather your raw customer notes, a rough sketch of market size (even a back-of-envelope TAM/SAM/SOM), and whatever unit economics you already have, even if they are guesses. Set an explicit objective for the session ("draft version 1 of the canvas and flag our three riskiest assumptions") rather than leaving it open-ended. A printable canvas, sticky notes, and a timer work fine; a digital board like Miro or a connected planning tool works better once you need to revisit and version the map later.
Pro Tip: Timebox each block to 10 minutes and move on even if it feels unfinished; a messy first draft beats a perfect block that stalls the whole session.
Step-by-step mapping workflow: prompts and outputs for each canvas block
Each block needs a specific prompt, not a blank box. Here is what to ask and what to capture for every one.
- Customer segments: Who specifically struggles with this problem today? Capture named personas, not vague categories like "small businesses."
- Value propositions: What job does this get done, and why would someone switch from their current solution? Capture the one-sentence pitch per segment.
- Channels: How will this segment first hear about you, and how will they actually buy or receive the product? Capture the specific channel, not a category.
- Customer relationships: Is this self-service, high-touch, or community-driven? Capture the expected support load.
- Revenue streams: What will this segment actually pay, and how often? Capture a number, even a rough one, tied to its source.
- Key resources: What do you need before you can deliver this, people, technology, or capital? Capture the resource and its lead time.
- Key activities: What is the one thing that, if done badly, breaks the whole model? Capture it plainly.
- Key partnerships: Who do you depend on that you do not control? Capture the dependency and its risk.
- Cost structure: What are the two or three costs that actually drive your economics? Capture them by order of size.
Once the blocks are filled, label every entry by the kind of risk it carries:
- Desirability: do people actually want this?
- Feasibility: can you actually build and deliver it?
- Viability: does the money work?
Assign a rough risk level (high, medium, low) to each labeled assumption based on how little evidence currently supports it and how much the model depends on it being true. An assumption with high dependency and low evidence goes to the top of your test list.
Versioning matters here as much as the content. Keep a dated history of each canvas revision rather than overwriting the same file, so you can trace why a pivot happened. Practitioner guidance recommends keeping a separate "shadow" canvas that tracks which entries are evidence-backed versus still speculative, which reduces the temptation to treat an early draft as finished and makes a later pivot much cleaner to explain. For concrete starting points, a set of business model canvas examples built for early-stage ventures can help you see how the blocks connect in practice before you fill in your own.
From map to experiments: converting assumptions into tests
A canvas full of assumptions is only useful once you know which ones to test first and how.
- Score each flagged assumption on desirability, feasibility, and viability, and rank the combination by how much the model collapses if it is wrong.
- Pick the top two or three and match each to a cheap experiment: a landing page test for demand, a concierge MVP for delivery feasibility, a handful of structured interviews for pricing willingness, or a small paid ad test for channel response.
- Define the metric and the threshold before you run anything, a click-through rate, a signup rate, or a specific price point someone agrees to.
- Run the test on a short cycle. A short experimentation cadence of one to four weeks per test, with a clear success threshold set in advance, tends to work better for early founders than longer, more elaborate pilots.
When results come in, compare them against your threshold rather than your hopes: a clear miss means revisiting that block of the canvas, not rationalizing the result. A clear win lets you move the assumption from "speculative" to "evidence-backed" on your shadow canvas. Re-map on a regular cadence, weekly in the earliest stage, monthly once the model stabilizes, rather than waiting for a single dramatic rewrite. For a fuller walkthrough of experiment types and what to measure, see how to validate a business idea before committing real budget to building.
Business model patterns and strategic mapping for innovation
Few business models are invented from scratch. Pattern research suggests that roughly 90% of business model innovation comes from recombining existing patterns rather than creating something entirely new, subscription models borrowed from software, applied to razors, or marketplace models applied to equipment rental.
A simple pattern checklist helps you generate alternatives quickly:
- Value proposition patterns: freemium, bundling, experience-based pricing
- Delivery patterns: direct, marketplace, franchise, white-label
- Capture patterns: subscription, usage-based, licensing, affiliate
Walk your own canvas through each category and ask whether swapping one pattern for another changes your riskiest assumption for the better. Connected strategy research frames this as redesigning relationships and delivery decisions, not just technology, often the real lever behind a stronger model.
For simpler ventures, a single canvas is enough. Once the model involves multiple interdependent processes, supply chains, multi-sided platforms, or regulated workflows, it helps to escalate to a deeper process or system map that captures timing and cause-effect relationships a static canvas cannot show.

Tools, templates, and a practical option for operationalizing mapping
The official Strategyzer canvas template remains the standard starting point, free to download and print. Beyond the template itself, a few features separate a tool that helps from one that just looks nice: version history, export formats that match how your team already works, and integration with whatever you use for building and project tracking.
A checklist worth applying to any tool you consider:
- Does it track experiment status against specific assumptions, not just store a static diagram?
- Does it export to formats your team actually uses, like Notion or Confluence?
- Does it sync with build tools, such as GitHub, once you move from planning to shipping?
- Can more than one person edit and comment without overwriting each other's work?
This is the gap that some connected planning tools aim to close. Starting from a one-line description of an idea, these tools build a connected model spanning scope, market sizing, competitor analysis, features, and requirements, so the pieces stay linked rather than living in separate documents. AI advisors may research and challenge the model as it develops. Different "lenses" can give founders different views into the same underlying model, with outputs that may include a build spec, a clarity scorecard, and exports to GitHub, Notion, or Confluence depending on the plan.
Pro Tip: Keep your experiment results and your canvas in the same system; a map that lives apart from your test log goes stale within weeks.
Two short mapping case sketches
- B2C example: A meal-kit idea started with a canvas assuming broad appeal to "busy professionals." A landing page test targeting a narrower segment, parents of toddlers, showed a stronger signup rate than the broad version. The map's customer segment and channel blocks both changed, narrowing the audience and shifting the primary channel to parenting communities.
- B2B example: A scheduling tool for clinics assumed a direct sales motion would close deals fastest. Four structured interviews with clinic managers revealed that referrals from existing software vendors drove nearly every past purchase decision. The key partnerships and channels blocks were rewritten around a partner integration strategy instead of outbound sales, and the revenue block shifted from one-time licensing to recurring subscription.
The lesson in both cases is the same: the first draft of the canvas is a starting guess, and the fastest way to a better model is a cheap test, not a longer planning session.
What phase-zero planning actually teaches founders
The founders who avoid expensive missteps are the ones who version their assumptions and test the riskiest ones first, not the ones with the most polished first draft. A 2026 study on early-stage founders found recurring structural weaknesses, vague value propositions, overly broad customer segments, and missing revenue logic, and noted that structured, AI-supported mapping can help surface these gaps before serious money is spent. That matches the thesis behind Klaritea's own approach: most founders who start building before clarifying their model spend heavily and rarely see it pay off, which is exactly the gap clarity-first mapping is meant to close.
— Karl
Try business model mapping with Klaritea
Some platforms are built around the idea that a connected, living model beats a static plan filed away after one workshop. By typing an idea as a single line, these tools can help turn it into a structured model covering market, competitors, features, and requirements, each piece updating as the others change, often with a clarity scorecard showing where the model still has gaps.
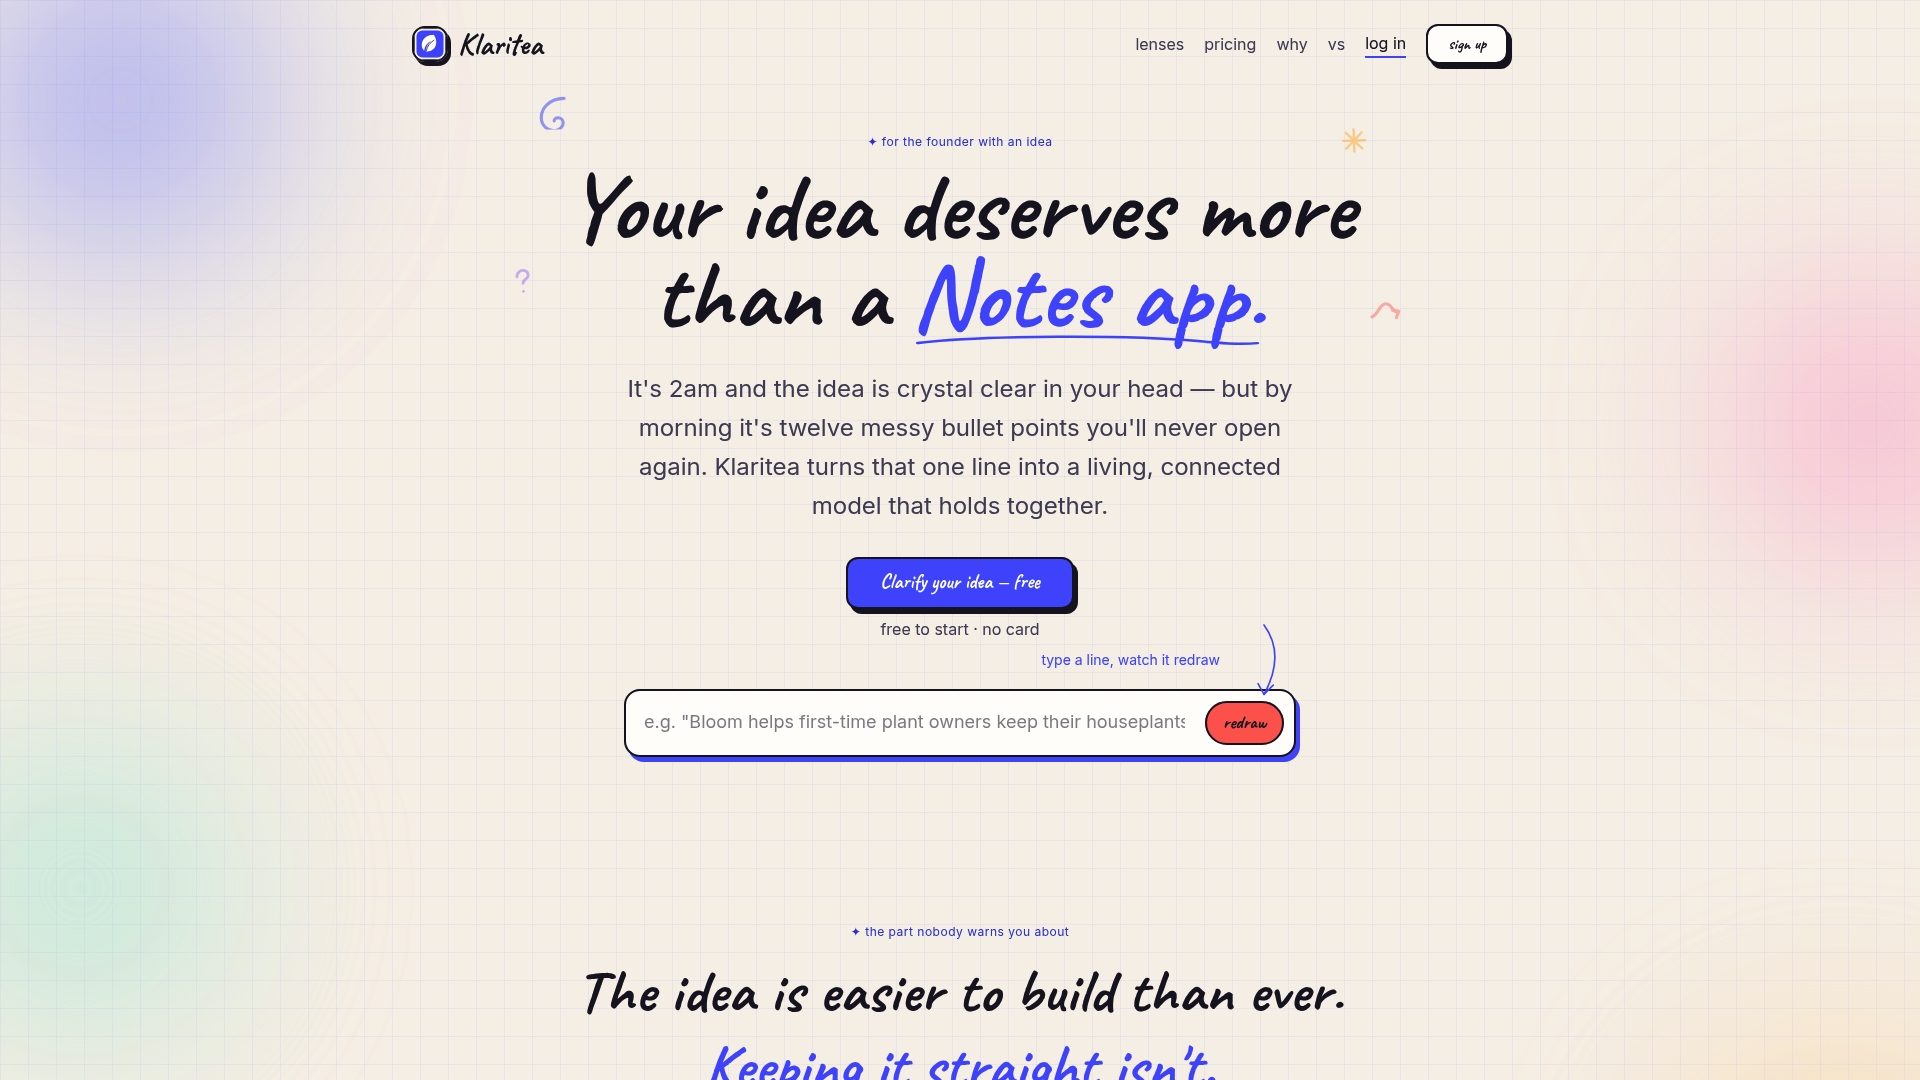
Start on the Free plan to map your first model, or compare the Klaritea and Pro tiers on our pricing page if you expect to need GitHub sync or exports to Notion and Confluence as your model matures.
FAQ
What are the 7 components of a business model?
Definitions vary across frameworks, but a common version covers value proposition, target customers, channels, customer relationships, revenue streams, key resources, and key activities. The Business Model Canvas itself uses nine blocks, adding key partnerships and cost structure to that list.
What are the 7 types of business models?
There is no single canonical list of seven, since pattern taxonomies catalog many more recognized models, from subscription and marketplace to franchise and freemium. Pattern research documents dozens of these patterns and shows that most new models recombine a handful of them rather than inventing something new.
What are the 9 elements of the BMC?
The nine elements are customer segments, value propositions, channels, customer relationships, revenue streams, key resources, key activities, key partnerships, and cost structure. The Strategyzer canvas template lays these out on one page, with market-facing blocks on the right and operational blocks on the left.
What are the four types of business models?
Business models are sometimes grouped broadly by revenue logic: one-time sale, subscription, usage-based, and platform or marketplace models that connect two or more sides. These broad groups sit inside the larger set of documented business model patterns founders draw on when designing or revising a model.
How do I turn a business model map into something I can test?
Start by labeling each assumption on the canvas as a desirability, feasibility, or viability risk, then rank them by how much the model depends on each being true. Match your top two or three to a cheap experiment, a landing page, a concierge test, or a short round of interviews, and set a success threshold before you run it, as practitioner guidance on living canvases recommends.
Sources
- Business Model Canvas — University of Toledo entrepreneur starter kit
- Study on early-stage founders and AI-supported mapping — FJCIS (2026)
- Business Model Canvas — Strategyzer library
- The Business Model Pattern Database — FH Wedel
- Connected strategy — Wharton Executive Education